")
Projects that involve the iRAP methodology and tools have resulted in fatality reductions of more than 40% and safety countermeasures that cost 10% or less of the road construction.
It is estimated that iRAP assessments have helped contribute to the prevention of almost 700,000 fatalities and serious injuries worldwide. The cost of performing an assessment using the iRAP methodology is often less than 0.1% of the cost of safety countermeasures implemented.
There are few better investments than in safer roads and safe speeds. Yet investment does not yet match the scale of this preventable public health crisis. Currently, only $1-3 is invested in road trauma prevention for every $100 of crash-related costs.
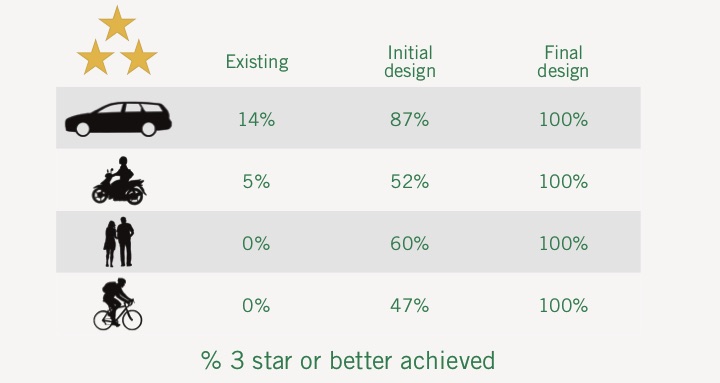
Examples of good designs:
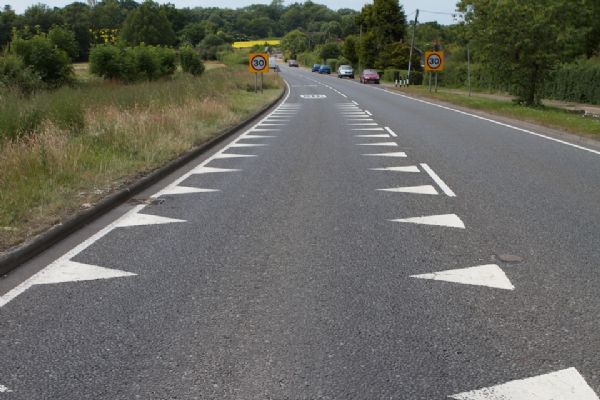
Safe speeds are safer for everyone
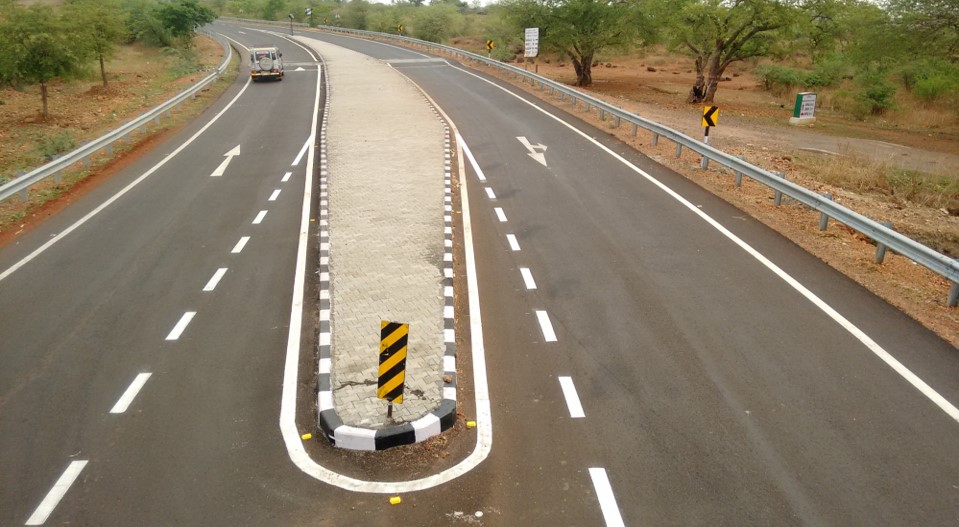
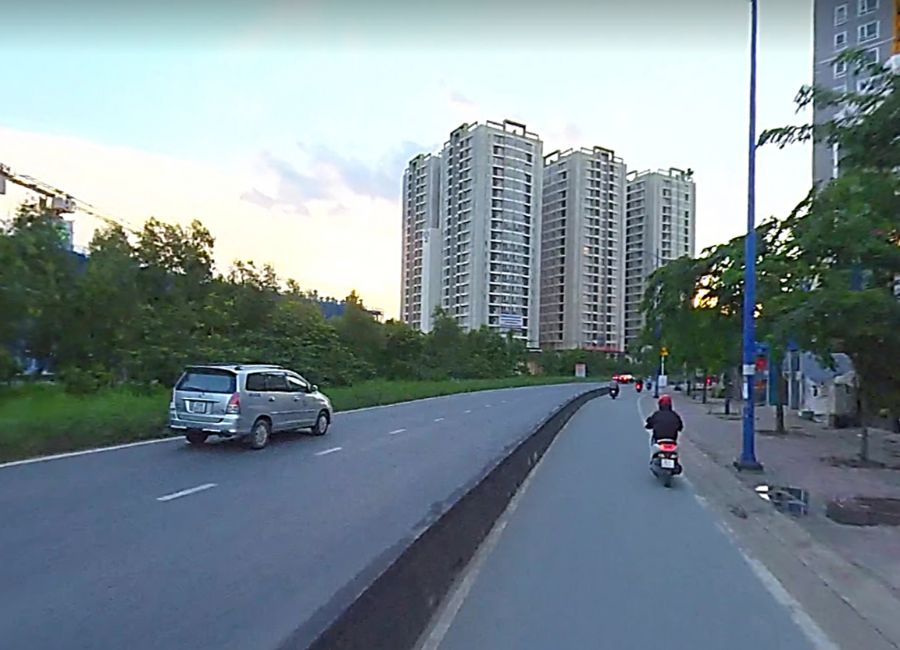
Head on crashes are less frequent with a median
Well-maintained roads are safer for everyone
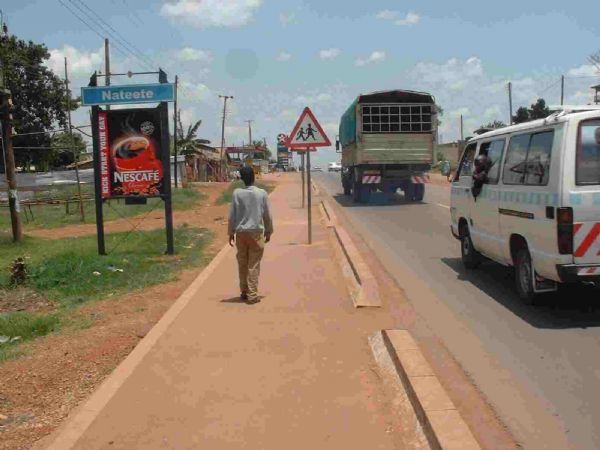
Pedestrians are safer with accessible sidewalks
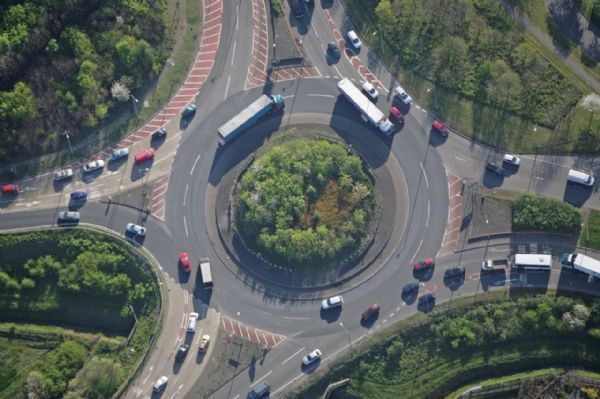
Intersections are safer with roundabouts
Motorcyclists are safer with dedicated lanes
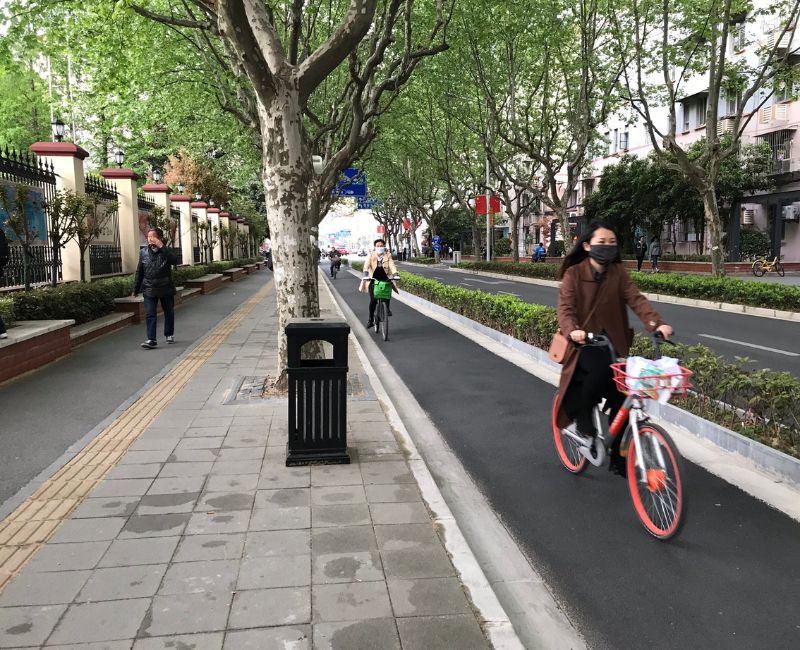
Bicyclists are safer with dedicated lanes
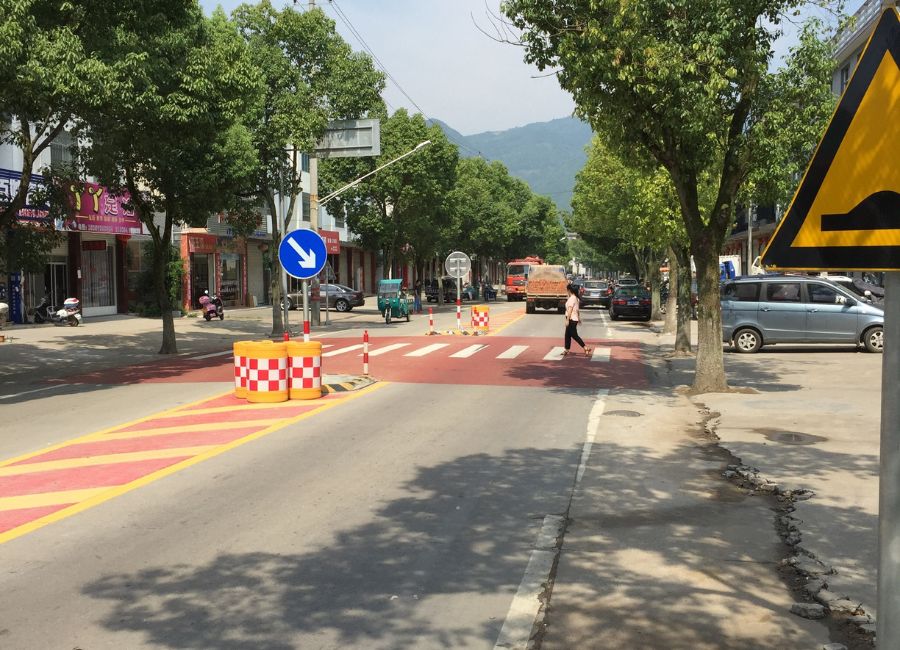
Pedestrians are safer with slow speed crossings
The Global Plan for the Decade of Action aims to halve road deaths and injuries and ensure that all road designs and 75% travel on existing roads are rated 3-stars or better for everyone.
Governments, development banks, donors and the private sector each have a role to play in mobilising the sustainable investment needed to eradicate serious road trauma, unlocking far-reaching economic, financial and social benefits.
To help support debate about the case for investment in safe speeds and infrastructure, iRAP has created the Business Case for Safer Roads. It shows that:
- If every country achieved the Global Plan targets for safer roads, more than 400,000 lives would be saved every year – over 1,000 lives saved a day.
- Investments of just 0.2% GDP per year through to 2030 will unlock this incredible outcome with $8 of benefits for every $1 invested.
- Benefits would be highest in low and middle income countries, where trauma rates are highest.
You can explore the life-saving impact of ensuring that most travel occurs on roads rated 3-stars or better for everyone for every country with the iRAP Safety Insights Explorer.
The Business Case for Safer Roads: >75% of travel on 3-star or better roads for all road users
UN TARGET 4: > 75% of travel on roads that meet technical standards for all road users by 2030 (equivalent to 3-star or better):
* Full datasets have not been available for some countries with these countries excluded from the analysis above. Total fatalities in 2016 is currently estimated to be 1.35 million people worldwide (https://www.who.int/violence_injury_prevention/road_safety_status/2018/en/).
")
Download the iRAP Global Business Case for Impact Investors – English version here
Download the iRAP Global Business Case for Impact Investors – Portuguese version here