Select Page

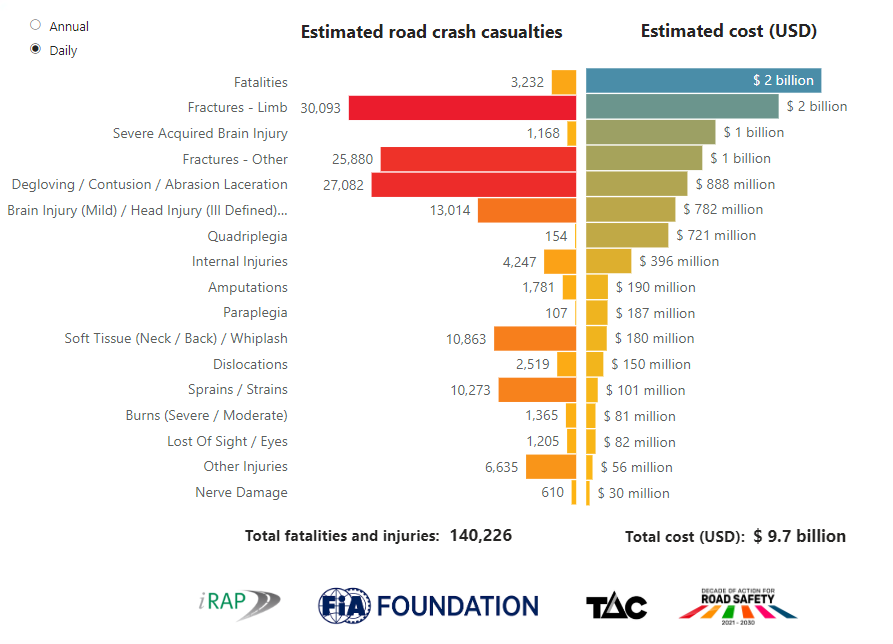
More than 3,600 people are killed in road crashes every day. Road crashes are the leading cause of death for young people.

But this is just the tip of the iceberg. More than 100,000 people suffer injuries every day, including severe brain injury, quadriplegia, fractures, internal injuries and burns. Road crashes often result in life-long suffering and disability, and place a huge toll on families and communities.

Apart from the emotional impact of serious crashes, the cost of emergency response, trauma wards and long-term health care is immense. Transport Accident Commission (TAC) claim data shows that more than half of all costs occur more than two years after a crash, buried deep within health and social welfare systems.

We also know that the cost of road crashes are borne by victims and society differently around the world. For example, a road crash victim with a treatable injury in a country with advanced health and welfare systems is likely to receive the treatment they need to achieve a fast and full recovery. In a country with poor health and welfare systems, the same victim is less likely to achieve a fast, or even full, recovery. In the first case, the costs of the crash are experienced in a short period and borne mostly by health and welfare systems. While in the second case, the costs are extended over a long period of time and are often borne by the victim and their family, impacting both quality of life and economic opportunity for multiple generations.

However, there is a significant gap in evidence and data about road crash injuries and their costs worldwide. To help support debate about the right scale of response to this enormous level of trauma and cost, iRAP has drawn on data from the WHO, TAC, Institute for Health Metrics and Evaluation, and the International Monetary Fund (IMF) to make simple, high-level estimates of the types of injuries that we expect are occurring in every country around the world, and their costs.

The estimates shine a light on the enormous level of trauma that children, youth, adults and the elderly suffer every day and the break-down by sex. They serve as an inspiration to do more and invest more in our efforts to improve road safety.

You can explore the estimates of the level and trauma and cost for every country with the iRAP Safety Insights Explorer.

Global burden of road crashes

Estimated number and cost of road crash deaths and injuries worldwide (cost in USD)

Scope of analysis
iRAP is a Registered Charity and has utilised the resources available to it through the donor support of the FIA Foundation to undertake this fit-for-purpose study of the global cost of road trauma. We welcome the support of other partners interested in extending the analysis.

Click on the (+) to read more on the Methodology

The methodology for estimating the number and cost of road crash deaths and injuries is summarised as follows.

1. Income level, region, number of fatalities, and fatalities by road user type

Data on country income levels, region, annual road crash fatalities and fatalities by road user type were sourced from the Global Status Report on Road Safety, 2018 (Global Status Report).[i] Point estimates for the modelled number of fatalities were used in the analysis.

2. Fatalities by age and sex

The Global Status Report does not report fatalities by age or sex. Thus, estimated numbers of road crash fatalities in 2019 by age (grouped into UNICEF age categories) and sex were obtained from the Global Health Data Exchange (GHDx).[ii] The relative proportion of fatalities by age and sex category was calculated for each country based on the GHDx data. These proportions were then multiplied by the modelled point estimate for fatalities reported in Global Status Report for that country to obtain the estimated number of deaths for each age and sex category.

3. Total number of injuries

Estimates of the numbers of injuries that occur each year around the world vary. The Global Status Report states “…up to 50 million injuries” occur each year, while the World Bank has stated “…20 to 50 million are seriously injured.”[i],[iii] Research prepared for iRAP suggests that, for the purposes of iRAP assessments, ratios of serious injuries to fatalities from 8:1 to 12:1 could be used.[iv] There is anecdotal evidence to suggest that ratios of injuries to fatalities tend to be higher in high income countries compared to low and middle income countries. Reasons for this include that crashes tend to be more survivable in high income countries. 

For the purposes of this analysis, which focuses on all injuries, the following ratios were used to estimate the total number of injuries in each country. 

Country income group

Injury severity

Fatalities Serious Other
Low 1 10.0 15.0
Middle 1 12.5 17.5
High 1 15.0 20.0

Applying these numbers with the Global Status Report fatality estimates produced a global estimate of slightly more than 37 million injuries per year, which is consistent with the WHO and World Bank estimates.

4. Injuries by road user type

The Global Status Report provides estimates of fatalities across five road user type categories for each country: vehicle occupants (drivers and passengers); motorcyclists; pedestrians; bicyclists; and others (where the road user type was not known). 

For the purpose of this analysis, fatalities in the “others” category were distributed proportionately across the other four road user types. For countries where no estimates by road user type were presented in the Global Status Report, the average distribution for countries in the corresponding region was used. 

The number of injuries by road user type in each country assumes the same proportions as those estimated for road fatalities in the Global Status Report. That is, the estimated injuries by each road user type in each country was calculated by multiplying the total number of injuries by the number of fatalities for each road user type as a percentage of all fatalities. 

5. Injuries by age and sex

The number of injuries in each age and sex category was estimated using the same approach adopted for fatalities. This approach assumes that the proportion of injuries by age and sex is consistent between road user types. The total number of estimated injuries were distributed across the age and sex categories in the same proportions as the fatalities in the GHDx dataset.

6. Injuries by injury type

The Transport Accident Commission (TAC) is a no-fault road trauma injury insurer in Victoria, Australia. TAC aggregated claim data for the period 2006 to 2017 was used as a reference for the types of injuries that occur in road crashes.[v] Numbers of claims and average life-time claim cost data were categorised by road user type, sex, age group (using UNICEF categories), and injury type (eg amputation, severe acquired brain injury). In total, more than 127,000 claims were used in the analysis. Where the data was sparse or outlier data (eg a one-off catastrophic claim) was identified for a particular category, the XXX statistical technique was used to generate suitable estimates for this high-level analysis. 

The proportion of injury types by road user type, gender and age was calculated based on the TAC claim data. The injury types in each country were then estimated by applying the same distribution of injury types for each road user type, age and sex category in that country.

7. Total cost of fatalities and injuries

For the purposes of this analysis, the total cost of fatalities and serious injuries estimated in the iRAP Business Case for Safer Roads was used for each country.[vi] It is acknowledged that the full injury burden presented above includes all injuries and therefore any cost estimate used in this analysis is likely to be conservative.

8. Costs of fatalities by road user type, age and sex

Based on the analysis by McMahon and Dahdah (2008),the cost of a fatality in each country was estimated as 70 times GDP per capita (PPP).[iv] The cost of fatalities for each road user type, sex, and age category in each country was estimated by multiplying the estimated number of fatalities by the estimated cost of a fatality for that country.

9. Cost of injuries by road user type, age and sex

To estimate the cost of injuries for each road user type, age, sex, and type of injury category in each country, the number of injuries in each category was first multiplied by the corresponding average claim cost in the TAC reference data to create an initial cost. The injury component of the total cost of fatalities and injuries in each country was then distributed according to the initial cost as a percentage of the sum of all initial costs in the country. 

10. Financial and social costs

It is noted that the financial cost estimates presented in the analysis represents the expected expenditure needed to provide a high-level of service and support for those injured in a road crash. In reality, the true financial costs in a country may be higher or lower depending on the level of care provided relative to the TAC insurance scheme. 

For the purpose of impact investment and development financing, users may wish to undertake a further breakdown of these costs that defines a proportion of these costs as financial and others as social (that fall on individuals, families, communities or business).  This breakdown can help identify the appropriate investor who will value the benefits accrued through reduced road trauma.

11. References

[i] WHO (2018) Global Status Report on Road Safety. https://www.who.int/publications-detail-redirect/9789241565684 

[ii] Institute for Health Metrics and Evaluation (2019) Global Health Data Exchange (GDHx). https://vizhub.healthdata.org/gbd-results/ 

[iii] World Bank (2018) The High Toll of Traffic Injuries: Unacceptable and Preventable. https://openknowledge.worldbank.org/bitstream/handle/10986/29129/HighTollofTrafficInjuries.pdf?sequence=5&isAllowed=y 

[iv] McMahon, K. and Dahdah, S. (2008) The True Cost of Road Crashes: Valuing Life and the Cost of a Serious Injury. https://resources.irap.org/Research/iRAP_report_the_true_cost_of_road_crashes_EN.pdf

[v] TAC and iRAP (2018) Road Injury Dashboard. https://www.irap.org/TAC-iRAP-Road-Injury-Dashboard

[vi] iRAP (2015) Business Case for Safer Roads. https://www.vaccinesforroads.org/business-case-for-safer-roads/

Print Friendly, PDF & Email

The International Road Assessment Programme (iRAP) is a Registered Charity with UN ECOSOC Consultative Status.
iRAP is registered in England and Wales under company number 05476000
Charity number 1140357

Registered office: 60 Trafalgar Square, London, WC2N 5DS
GET IN TOUCH │ Europe │ Africa │ Asia Pacific │ Latin America and Caribbean │ North America

en_USEnglish
Share This