Select Page

Crash Data

Crash Risk Mapping 

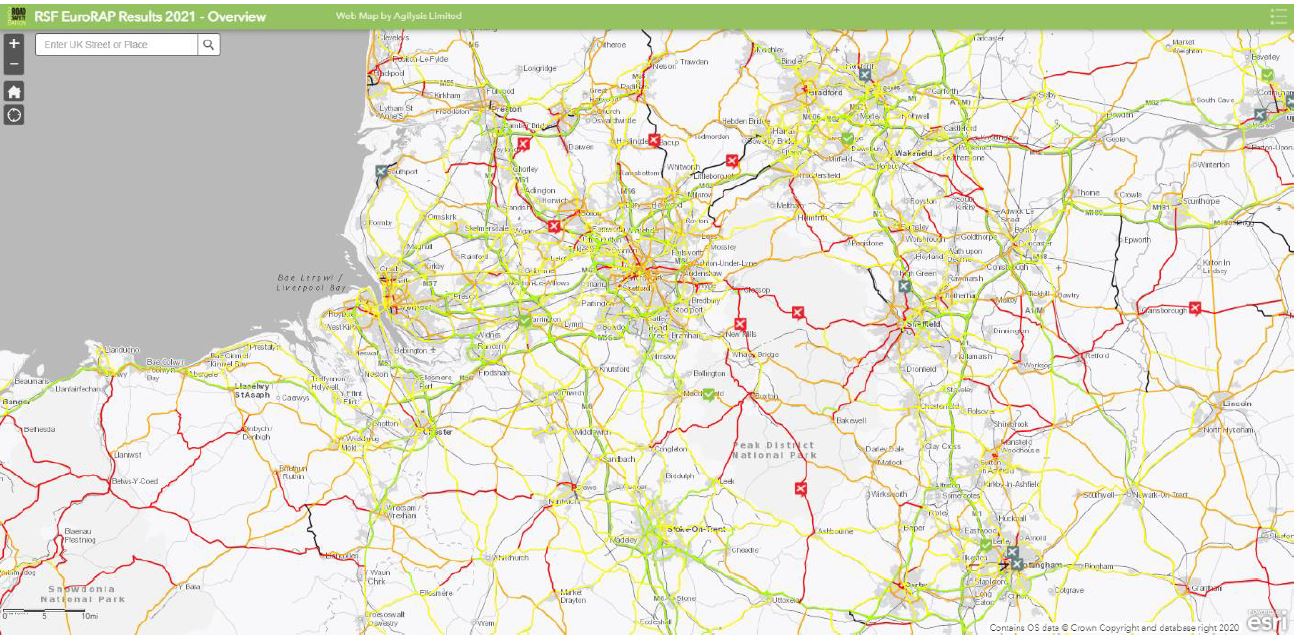
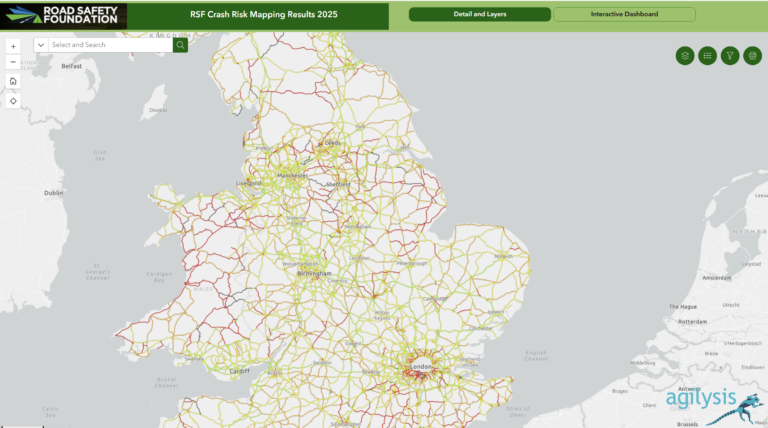
Crash Risk Maps use detailed crash data to capture the combined risk arising from the interaction of road users, vehicles and the road environment. Risk Maps provide an indication of the overall road system performance.

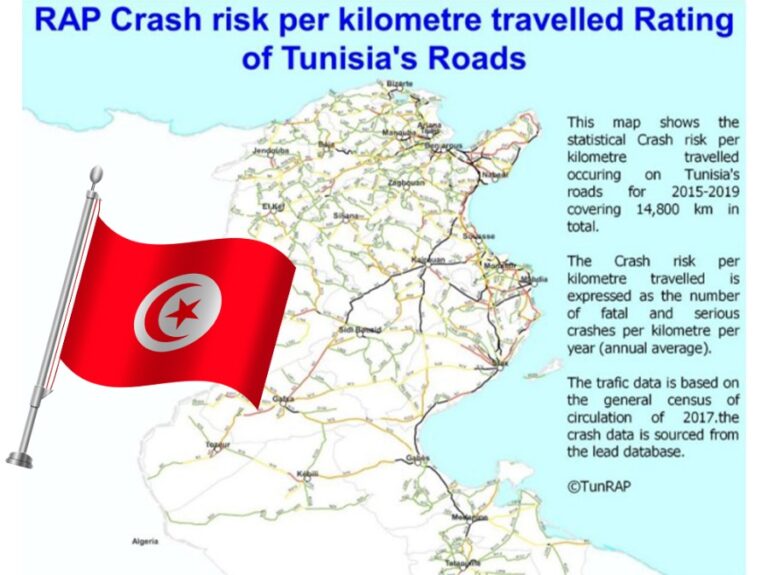
The maps provide an at-a-glance and objective view of where fatal and serious injury crashes have occurred and where serious crash risk is greatest. Using a global methodology allows benchmarking where desired (e.g. crash rates on motorways; pedestrian crash rates in cities).  Primary metrics include crash rates per kilometre/mile and crashes rates per kilometre/mile travelled with more detailed versions including road user, age group or in relation to average crash rates for that road type.

Crash Risk Maps and Star Ratings are often used together as part of a strategic approach to managing risk and investment. They also provide a useful source of calibration for FSI Estimates and Investment Plans.

Visit the Road Safety Foundation’s Crash Risk Mapping portal here

Updated iRAP Crash Risk Mapping Manual Now Available

Stats on crashes that cause death and serious injury are the ultimate indicator of road safety performance on road networks. We are proud to announce the updated iRAP Crash Risk Mapping Manual is now available. This essential resource reflects the latest knowledge and...

25,000km of Crash Risk Mapping for Spain released

The RACC Mobility Club and Real Automóvil Club de España (RACE) have presented their 20th edition of annual Crash Risk Mapping of the Spanish road network. For the first time in six years, the sections of the State Highway Network with a "high risk" of serious or...

Road Safety Performance and Investment Opportunities – Britain’s Motorways and ‘A’ Roads Crash Risk Mapping Results 2023

This year’s report tracks the safety performance of motorways and ‘A’ roads in Great Britain, These roads make up less than 13 per cent of the whole network, but almost 60 per cent of all fatal crashes and more than 40 per cent of serious road crashes occur on these...

14,800km of Tunisia Risk Mapping complete

University of Sfax has completed a 14,800 km of Risk Mapping assessment of Tunisia's road network to inform an understanding of crash risk and evidence-based investment to reduce road traffic deaths and reduce serious injuries in the country. Tunisia is the second...

RAP Tools to Support the Global Plan

iRAP and its partners have developed a suite of tools that use the iRAP methodology to support the Global Plan for Decade of Action for Road Safety 2021-2030, which sets a target of 50% reduction in road deaths and injuries.These RAP Tools also support the achievement...

Looking Back Moving Forward – UK’s Crash Risk Mapping Annual Results 2020 released

17 September 2020: Hosted by Lord Whitty, Chairman of the Road Safety Foundation, the Great Britain EuroRAP 2020 Crash Risk Mapping Annual Results were launched at a virtual event. The 20th Edition of this report identifies an investment package of £1.2 billion which...

2017 UK Risk Mapping & Road Crash Index Launched

The Road Safety Foundation, in partnership with Ageas UK, has today launched an innovative interactive Road Crash Index alongwith its latest UK risk mapping and performance tracking report on the EuroRAP network of Motorways and A roads. According to the report,...

Road Risk Mapping: Design specification

 Download This document sets out the design and cartographic specification for the production of Risk Mapping (using crash data) to a standardised format. Click the file icon above to download the file. Road Risk Mapping: Design specification

Maps

Analysis

Print Friendly, PDF & Email

The International Road Assessment Programme (iRAP) is a Registered Charity with UN ECOSOC Consultative Status.
iRAP is registered in England and Wales under company number 05476000
Charity number 1140357

Registered office: 60 Trafalgar Square, London, WC2N 5DS
GET IN TOUCH │ Europe │ Africa │ Asia Pacific │ Latin America and Caribbean │ North America

en_USEnglish
Share This