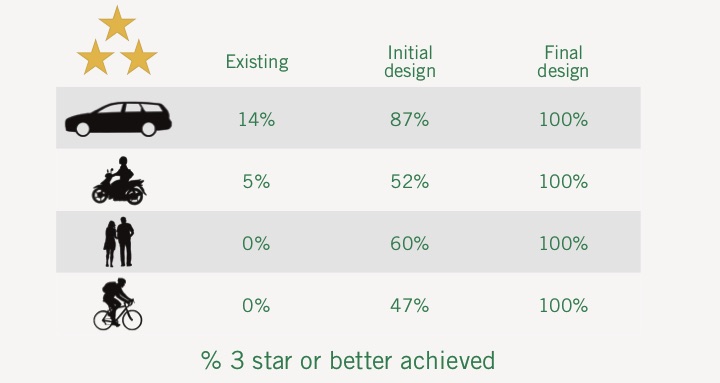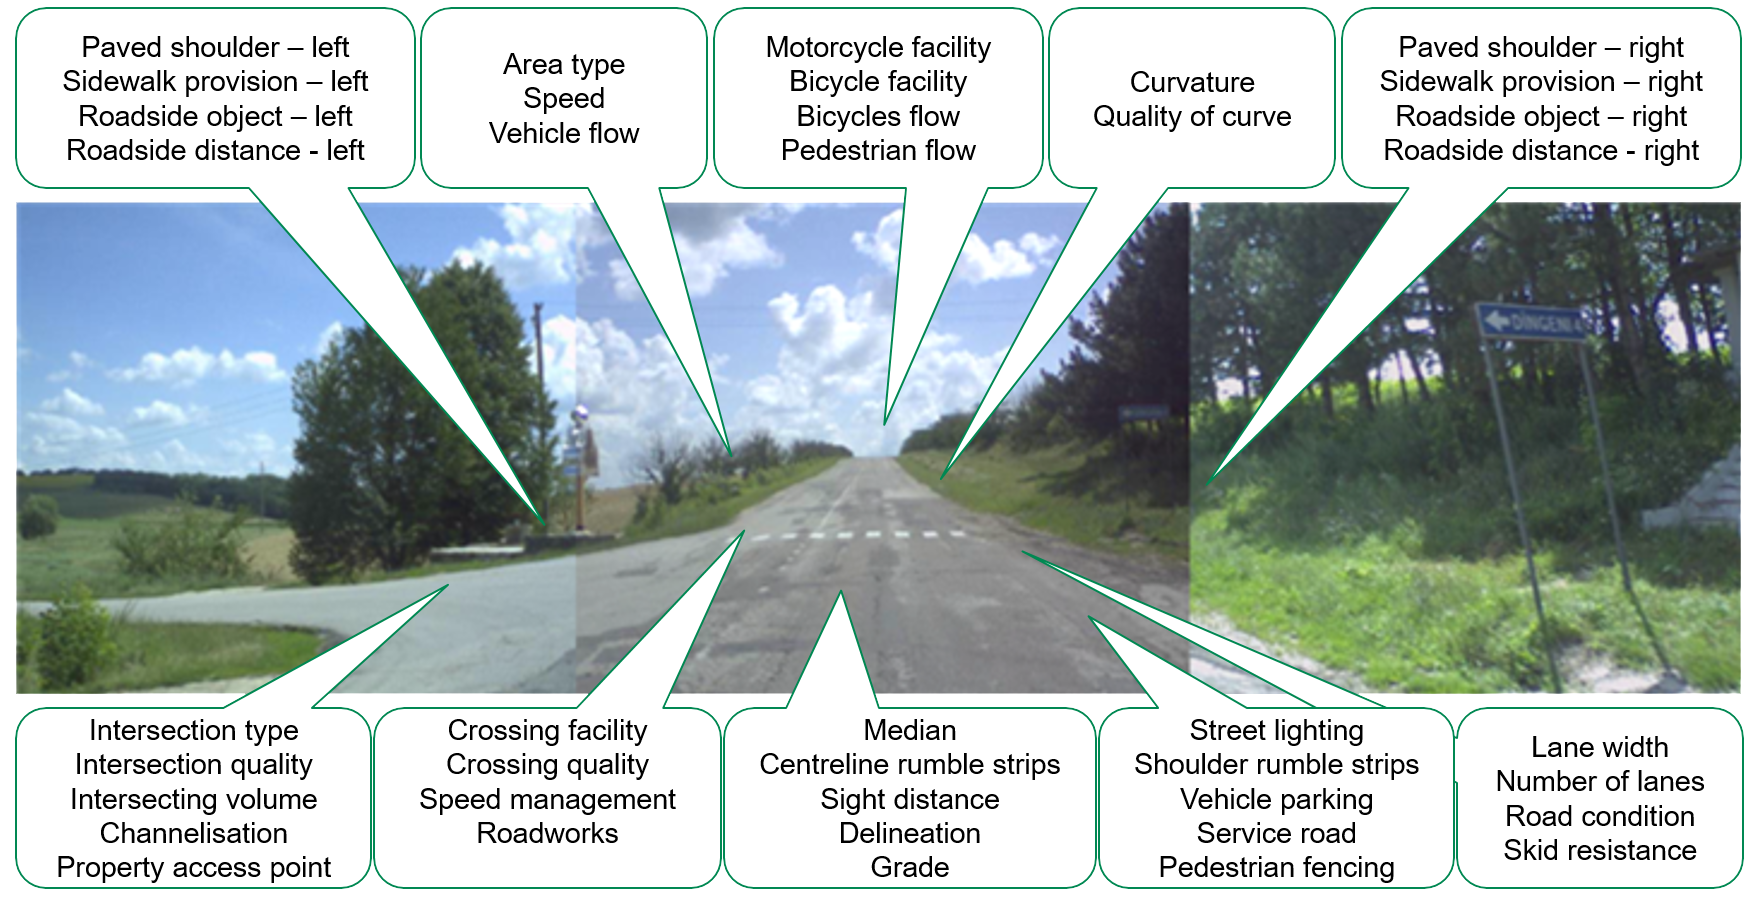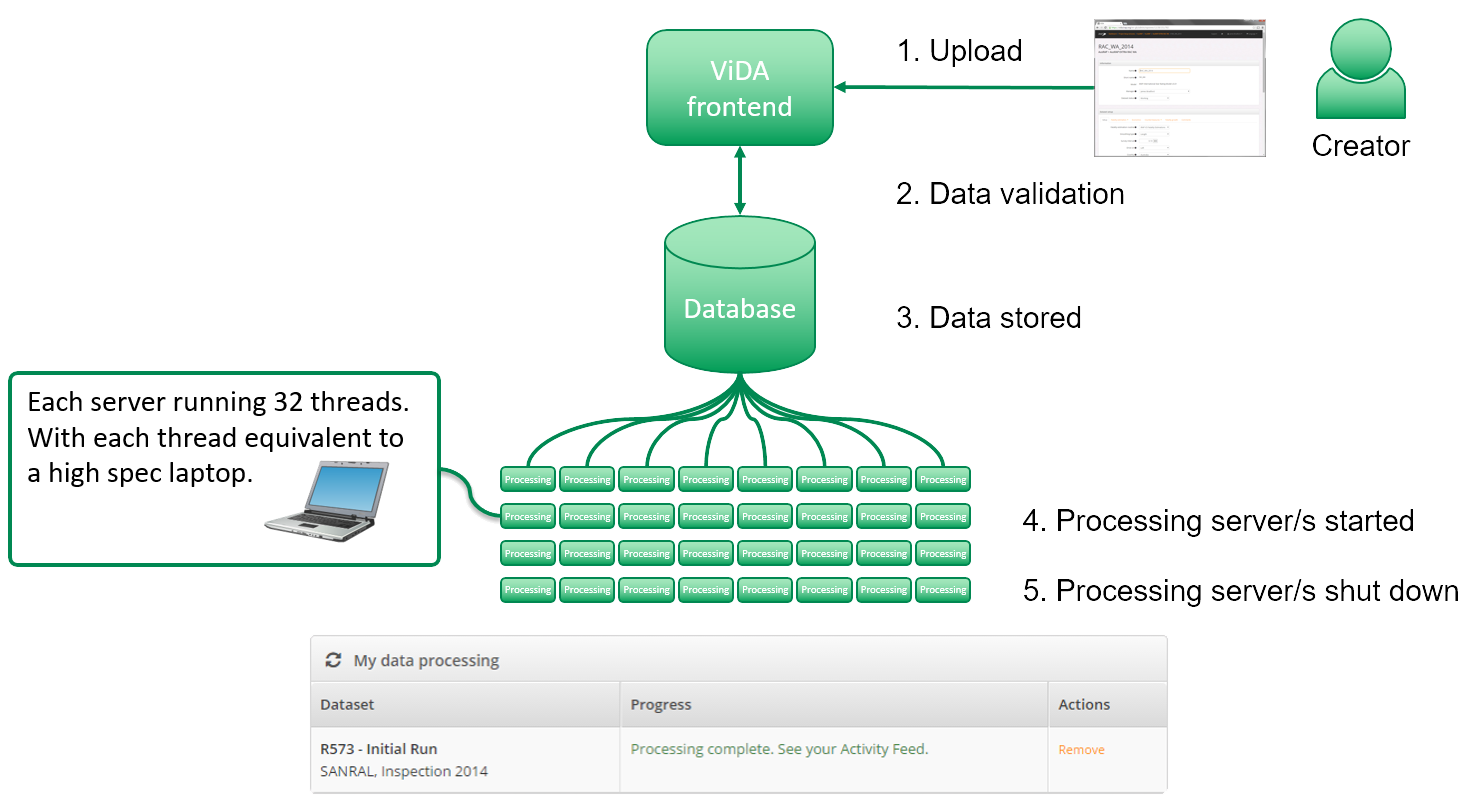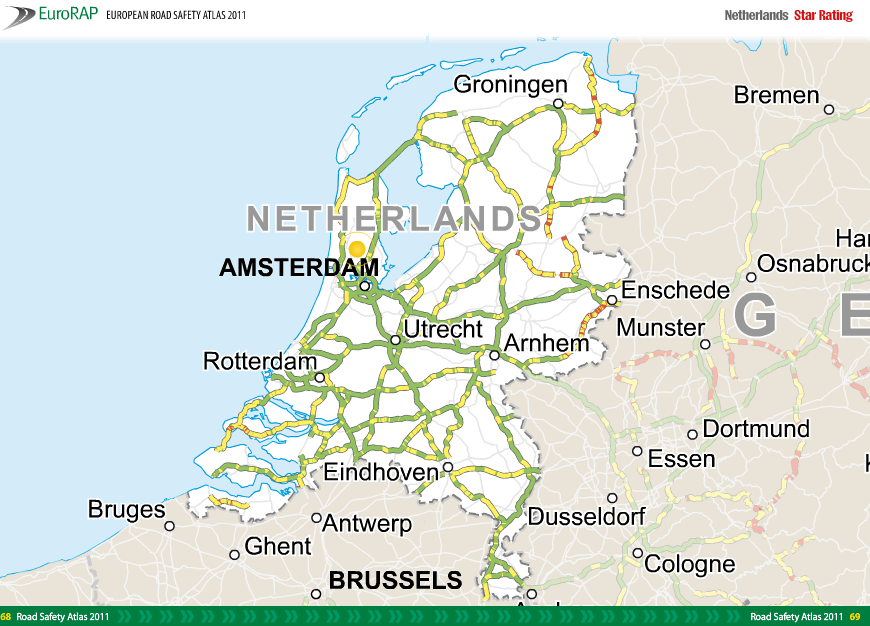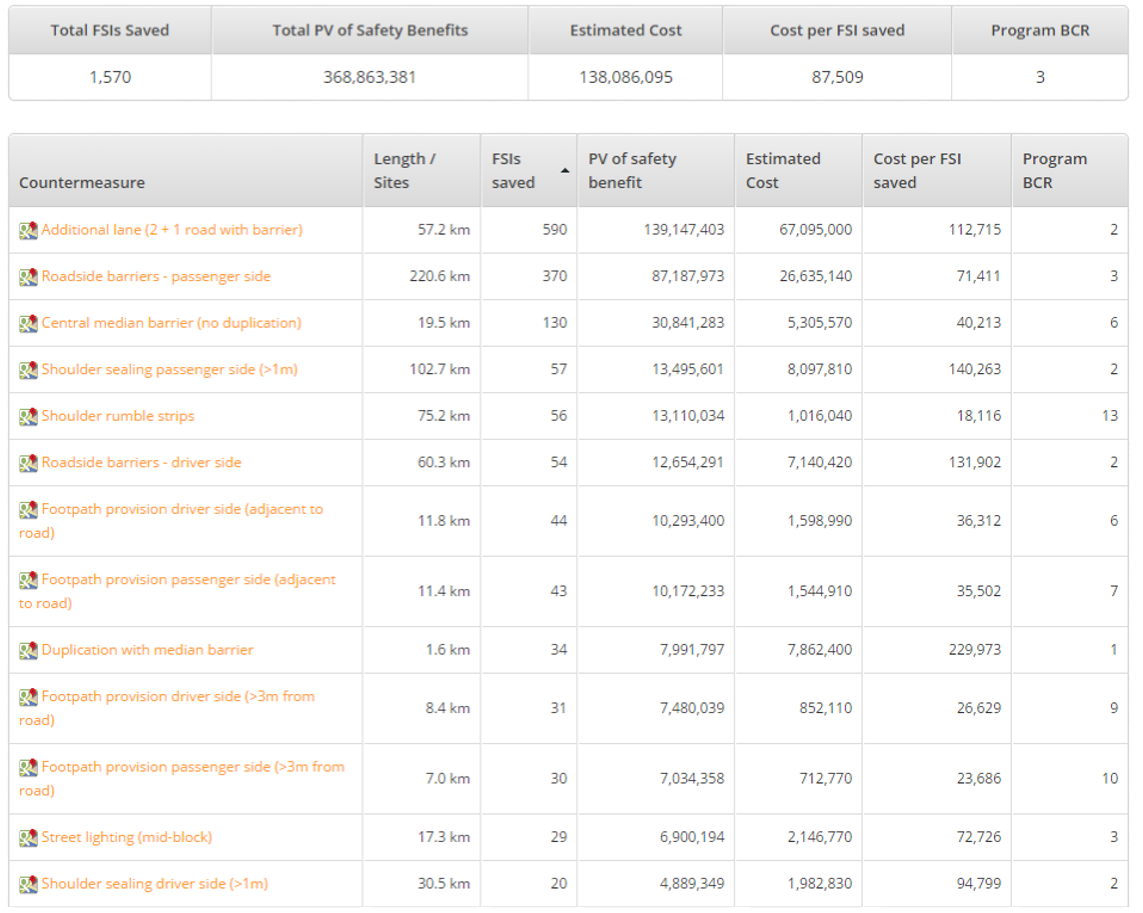
Projects that involve the iRAP methodology and tools have resulted in fatality reductions of more than 40% and safety countermeasures that cost 10% or less of the road construction.
It is estimated that iRAP assessments have helped contribute to the prevention of more than 400,000 fatalities and serious injuries worldwide. The cost of performing an assessment using the iRAP methodology is often less than 0.1% of the cost of safety countermeasures implemented.
There are few better investments than in safer roads and safe speeds. Yet investment does not yet match the scale of this preventable public health crisis. Currently, only $1-3 is invested in road trauma prevention for every $100 of crash-related costs.
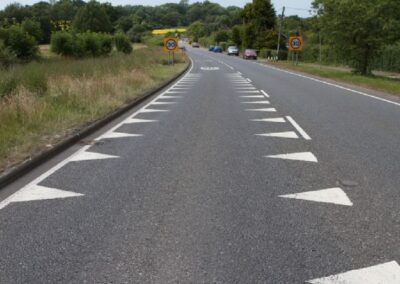
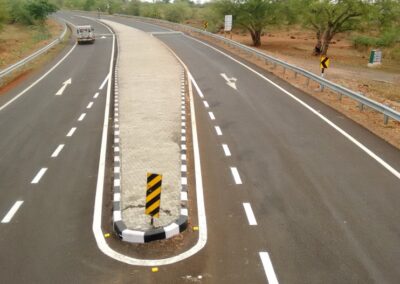
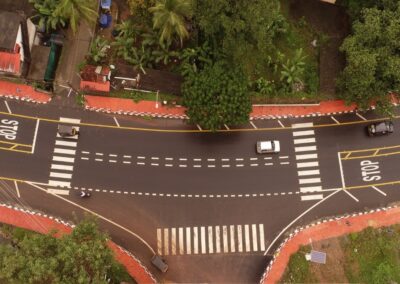
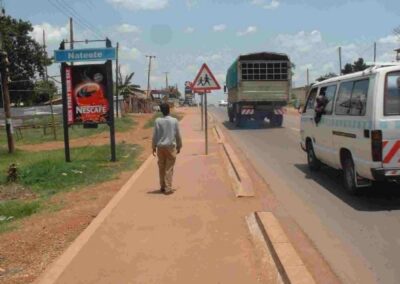
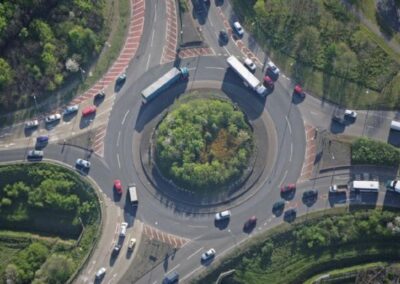
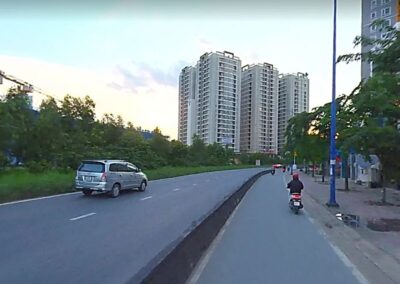
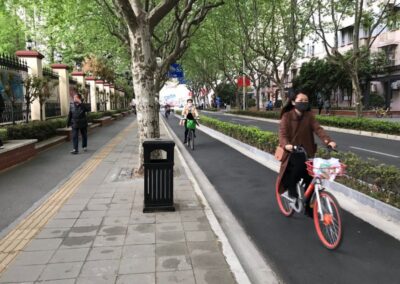
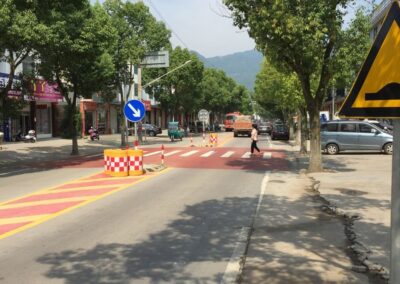
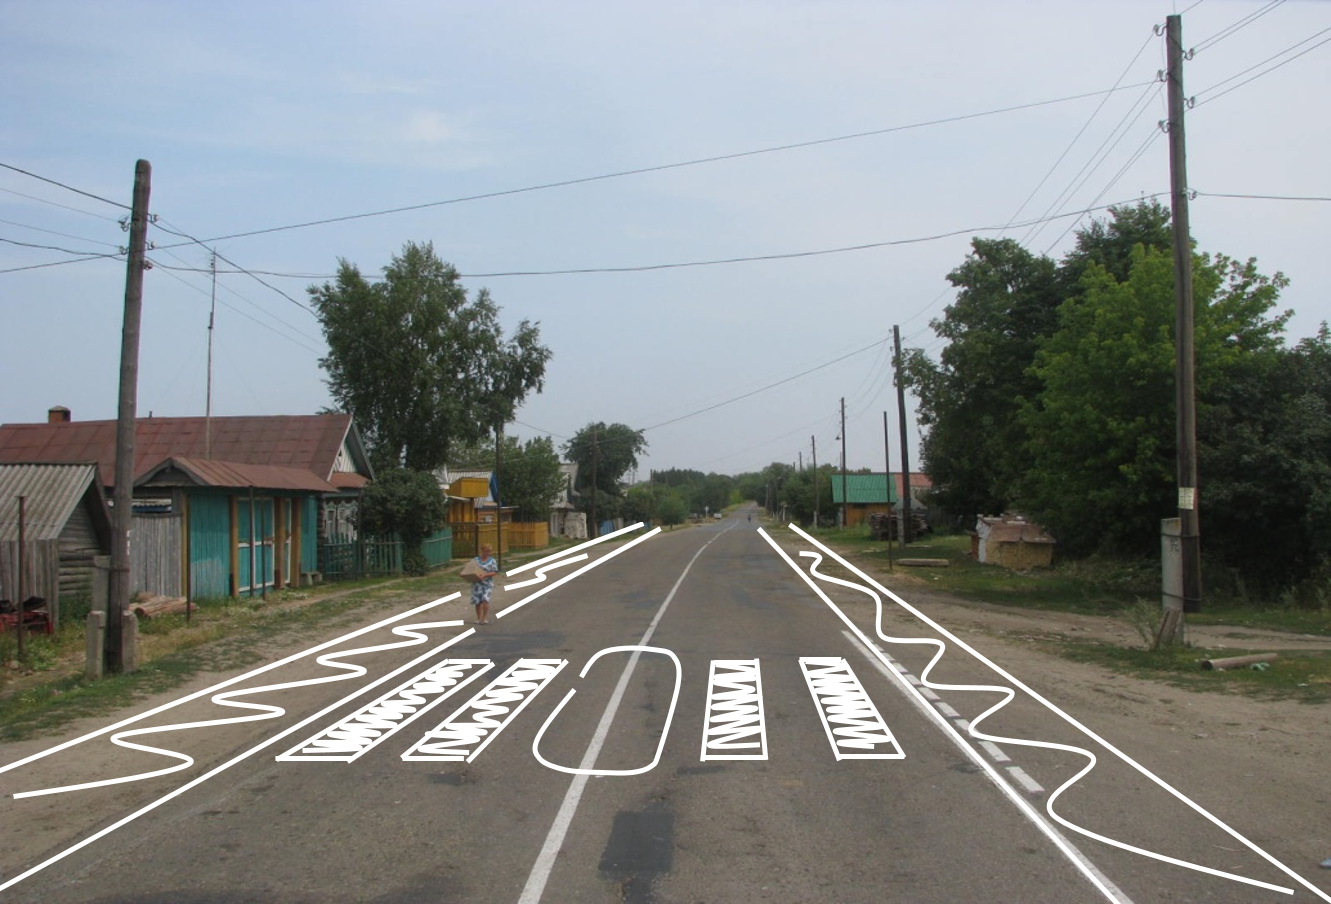
Examples of good designs:
The Global Plan for the Decade of Action aims to halve road deaths and injuries and ensure that all road designs and 75% travel on existing roads are rated 3-stars or better for everyone.
Governments, development banks, donors and the private sector each have a role to play in mobilising the sustainable investment needed to eradicate serious road trauma, unlocking far-reaching economic, financial and social benefits.
To help support debate about the case for investment in safe speeds and infrastructure, iRAP has created the Business Case for Safer Roads. It shows that:
- If every country achieved the Global Plan targets for safer roads, more than 450,000 lives would be saved every year – over 1,200 lives saved a day.
- Investments of just 0.1-0.2% GDP per year through to 2030 will unlock this incredible outcome with $8 of benefits for every $1 invested.
- Benefits would be highest in low and middle income countries, where trauma rates are highest.
You can explore the life-saving impact of ensuring that most travel occurs on roads rated 3-stars or better for everyone for every country with the iRAP Safety Insights Explorer.
The Business Case for Safer Roads: >75% of travel on 3-star or better roads for all road users
UN TARGET 4: > 75% of travel on roads that meet technical standards for all road users by 2030 (equivalent to 3-star or better):
| Low Income | Lower-Middle Income | Upper-Middle Income | High Income | All | ||||||
|---|---|---|---|---|---|---|---|---|---|---|
| Number of countries | 29 | 52 | 53 | 51 | 185 | |||||
| CURRENT SITUATION | ||||||||||
| Annual number of fatalities | 172,759 | 591,534 | 485,109 | 95,415 | 1,344,817 | |||||
| Population | 621 mil | 3,007 mil | 2,613 mil | 1,148 mil | 7,390 mil | |||||
| Fatalities per 100,000 population | 27.8 | 19.7 | 18.6 | 8.3 | 18.2 | |||||
| Annual number of fatalities and serious injuries | 1,900,349 | 6,506,874 | 5,336,199 | 1,049,565 | 14,792,987 | |||||
| Annual cost of fatalities and serious injuries (% of GDP) | 7.1% | 4.7% | 4.5% | 2.0% | 3.0% | |||||
| WHAT CAN BE ACHIEVED with >75% of travel on 3-star or better roads for all road users | ||||||||||
| % of travel on 3-star or better roads for all road users by 2030 | >75% | >75% | >75% | >75% | >75% | |||||
| Infrastructure and Speed Management Investment required | 12 bn | 152 bn | 352 bn | 868 bn | 1,384 bn | |||||
| Annual GDP (2020) | 531 bn | 8,073 bn | 26,350 bn | 56,269 bn | 91,223 bn | |||||
| Annual Investment as a % of GDP (2020-2030) | 0.20% | 0.17% | 0.12% | 0.14% | 0.14% | |||||
| Reduction in fatalities per year | 76,271 | 200,212 | 162,167 | 21,040 | 459,691 | |||||
| Reduction in fatalities and serious injuries (FSI) over 20-years | 16,779,677 | 44,046,532 | 35,676,817 | 4,628,895 | 101,131,921 | |||||
| Economic Benefit | 205 bn | 1,657 bn | 5,307 bn | 3,380 bn | 10,550 bn | |||||
| Benefit Cost Ratio | 18 | 11 | 15 | 4 | 8 | |||||
* Full datasets have not been available for some countries with these countries excluded from the analysis above. Total fatalities in 2016 is currently estimated to be 1.35 million people worldwide (https://www.who.int/violence_injury_prevention/road_safety_status/2018/en/).
Download the iRAP Global Business Case for Impact Investors – English version here
Download the iRAP Global Business Case for Impact Investors – Portuguese version here
Click on the (+) to read more on the Methodology
Star Rating Performance Assumptions
An analysis of over 358,000km of recent star rating and investment plans undertaken by government, development bank and mobility club partners worldwide has informed the existing star rating performance levels for each World Bank income category. The star rating policy and target setting work by WHO, OECD, iRAP and leading countries has been used to inform the 2030 targets by income category.
| EXISTING ROADS | % OF TRAVEL | ||||
| 1-STAR | 2-STAR | 3-STAR | 4-STAR | 5-STAR | |
| Low income | 50% | 30% | 20% | 0% | 0% |
| Lower middle income | 30% | 30% | 40% | 0% | 0% |
| Upper middle income | 25% | 30% | 45% | 0% | 0% |
| High income | 10% | 30% | 50% | 10% | 0% |
| 2030 TARGET | % OF TRAVEL | ||||
| 1-STAR | 2-STAR | 3-STAR | 4-STAR | 5-STAR | |
| Low income | 0% | 25% | 75% | 0% | 0% |
| Lower middle income | 0% | 25% | 70% | 5% | 0% |
| Upper middle income | 0% | 25% | 60% | 10% | 5% |
| High income | 0% | 25% | 50% | 15% | 10% |
Annual fatalities
Based on the number of road traffic deaths in 2016 as estimated by the WHO. Analysis by OECD IRTAD highlights a longer term stabilisation of road fatalities with minor fluctuations from year to year in the 33 IRTAD countries (1.7% decrease in 2018). For the purpose of estimating future lives saved, it was therefore assumed that 2020 fatalities are equivalent to the 2016 estimate.
Annual fatalities and serious injuries
Following research by McMahon and Dahdah, it was assumed that 10 serious injuries occur for each death. This is expected to provide a conservative estimate compared to the analysis in the Global Toll page which is based on TAC data.
Annual cost of fatalities and serious injuries
The estimated cost of fatalities and serious injuries follows research by McMahon and Dahdah, assuming that a fatality in a country costs 70 x GDP per capita and a serious injury costs one quarter of a fatality. GDP per capita data was sourced from the International Monetary Fund (IMF).
Infrastructure and speed management investment required
Investment levels are based on average countermeasure costs and Safer Road Investment Plans from over XXXXkm of iRAP assessments undertaken in recent years. Road lengths are sourced from the CIA Factbook. The Star Rating of a road can be improved by either improving the design (e.g. low-cost treatments such as line-marking, signage, roadside hazard removal; higher cost treatments such as barriers, footpaths, intersection upgrades) or through a reduction in the operating speed (e.g. traffic calming, lower urban speed limits, point to point speed cameras, vehicle technologies). Further information on this is available in the Road Safety Toolkit and the impacts of changes to design and speeds can be explore with the Star Rating Demonstrator.
For this analysis it was assumed that targeting the highest volume 10% of roads for each road user group with major infrastructure upgrades where required would address safety levels for >50% of travel (e.g. CBD areas and major shopping and education areas for pedestrians and cyclists; motorcycle routes and high-volume national highways, motorways and urban arterials for vehicles). An average investment of $400,000 per km in high income countries; $250,000 in upper-middle income countries; $150,000 in lower-middle income countries; and $100,000 in low income countries has been assumed. In using these estimates, it is noted that some road sections will require more than these levels of investment and some may not require any investment at all. Lower cost maintenance upgrades and speed management initiatives (assumed to be equivalent to 10% of the major upgrade costs) have been assumed across the lower volume parts of the network.
Reduction in fatalities (and serious injuries)
Reduction in fatalities and serious injuries have been calculated over a 20-year period in line with typical analysis periods used for road infrastructure projects. Reductions in fatalities and serious injuries have been applied to the percentage of travel at each Star Rating level and based on the crash cost reduction per vehicle kilometre travelled for each improved Star Rating (e.g. OECD 2016, Zero Road Deaths and Serious Injuries) and similar studies worldwide. Reductions for each incremental improvement in Star Rating have typically varied between 43% and 75% in these studies. For the purpose of this analysis the more conservative estimate of a 40% reduction in fatal and serious injury outcomes for each incremental star rating improvement has been used.
| STAR RATING | RELATIVE PROPORTION OF FATALITIES AND SERIOUS INJURIES |
| 1 | 1 |
| 2 | 0.6 |
| 3 | 0.36 |
| 4 | 0.216 |
| 5 | 0.1296 |
Economic benefit
The present value of fatalities and serious injuries is calculated over 20 years. The GDP per capita value for 2020 was used for calculation of the annual benefits in year 1. Long-term benefits (Net Present Value) has been calculated using a discount rate of 4%.
Benefit cost ratio
The present value of the economic benefit divided by the current value of the cost to improve roads. It is noted that in most cases the future investment will be spread across a number of years and using the full present-day cost will provide a more conservative estimate.
Acknowledgements
The Business Case for Safer Roads was prepared by Rob McInerney and Greg Smith from iRAP. Thanks to Blair Turner from the World Bank GRSF for undertaking a peer review of the Business Case for Safer Roads. To assist iRAP in undertaking more detailed analyses of the country by country potential for safer roads please contact icanhelp@irap.org.


