This page illustrates examples of interactive reports that have been produced using iRAP data. The examples include reports created by the iRAP and examples created by iRAP partners. If you are interested in creating an interactive report, or know of good examples that could be highlighted on this page, please contact us (via email comms@irap.org).
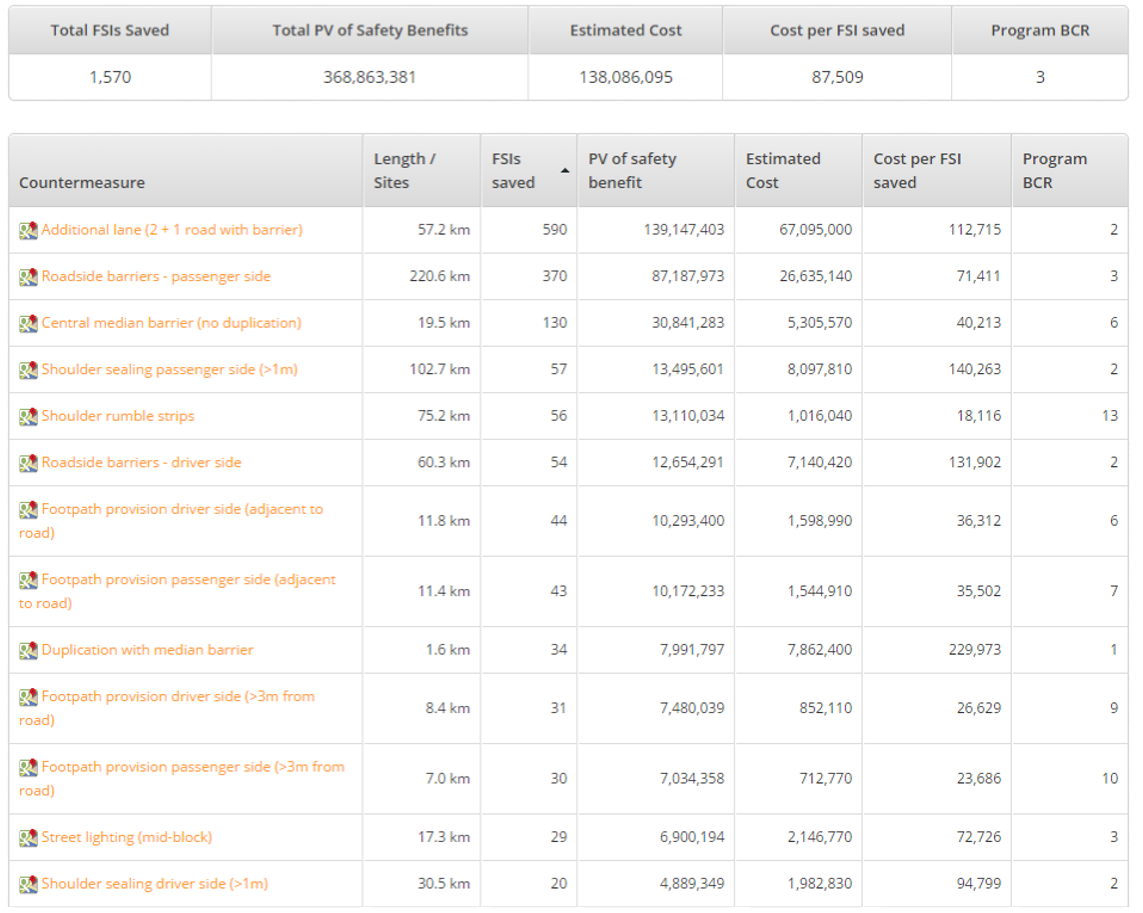
Enhanced Safer Roads Investment Plans
This template enables enhanced Safer Roads Investment (SRIP) reporting. If you are interested in trying the template with your own data, please contact judy.williams@irap.org
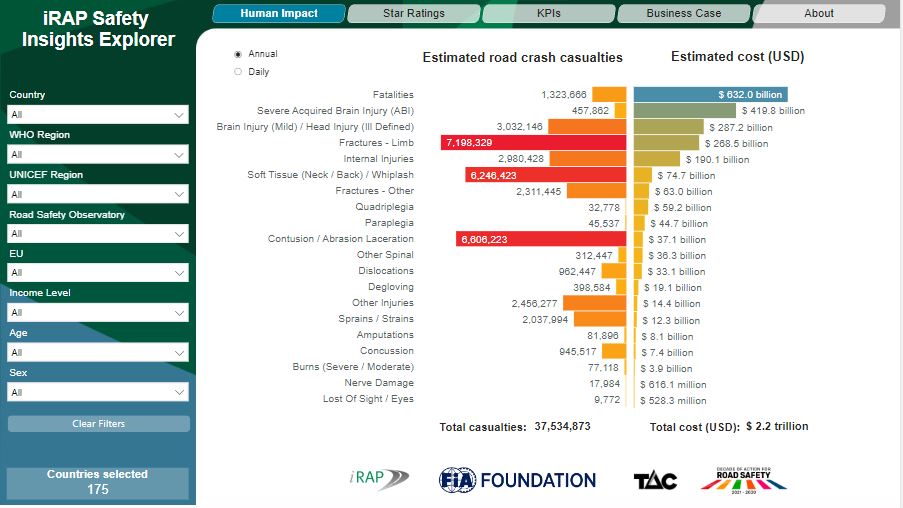
iRAP Safety Insights Explorer
The iRAP Safety Insights Explorer shines a light on the true scale of road crashes, the safety of the world’s roads, and the positive impact that can be made with investment.
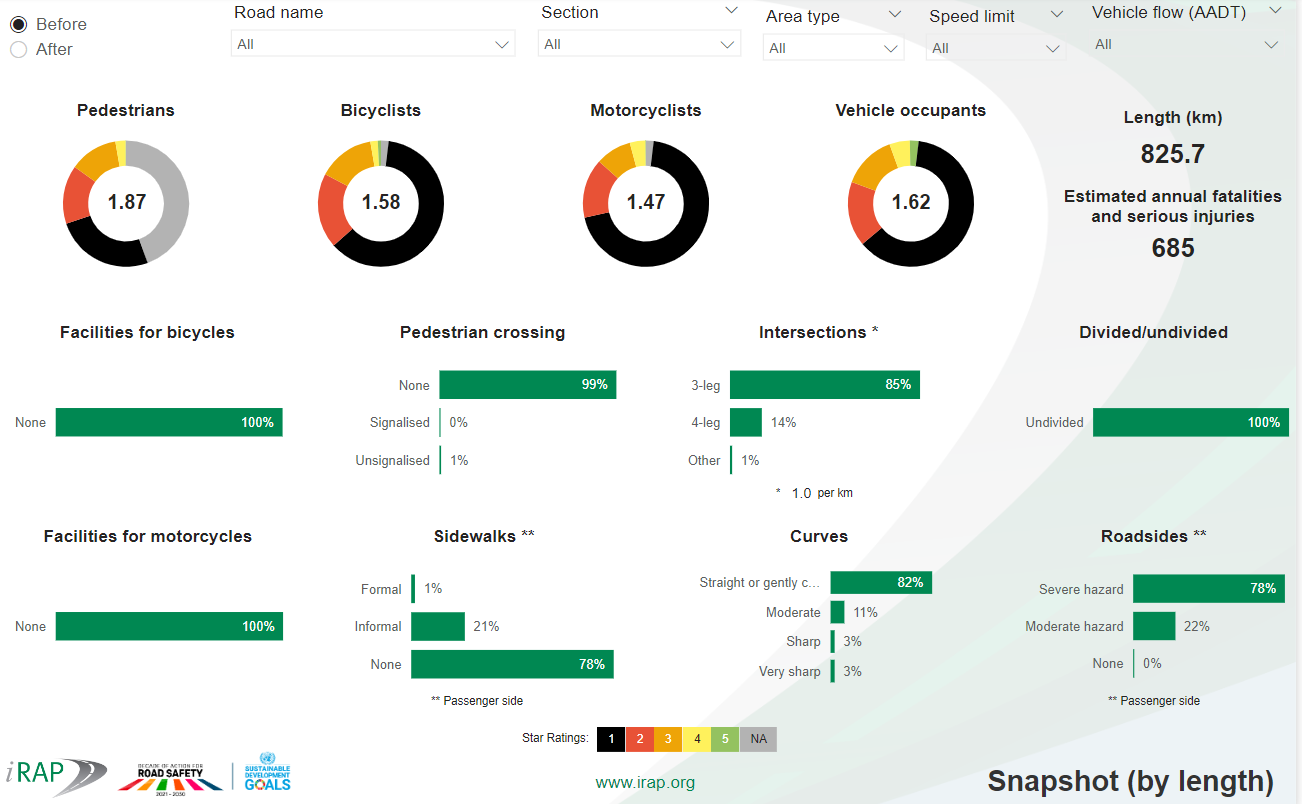
iRAP Power BI Project Dashboard
Bring your iRAP reports to life with this free Power BI template. Designed for use with standard ViDA download files (click on image above to download files)
Star Rating for Schools Safe Schools Tracker
Star Ratings for Schools (SR4S) interactive report that shares insights about how safety around schools is being improved.
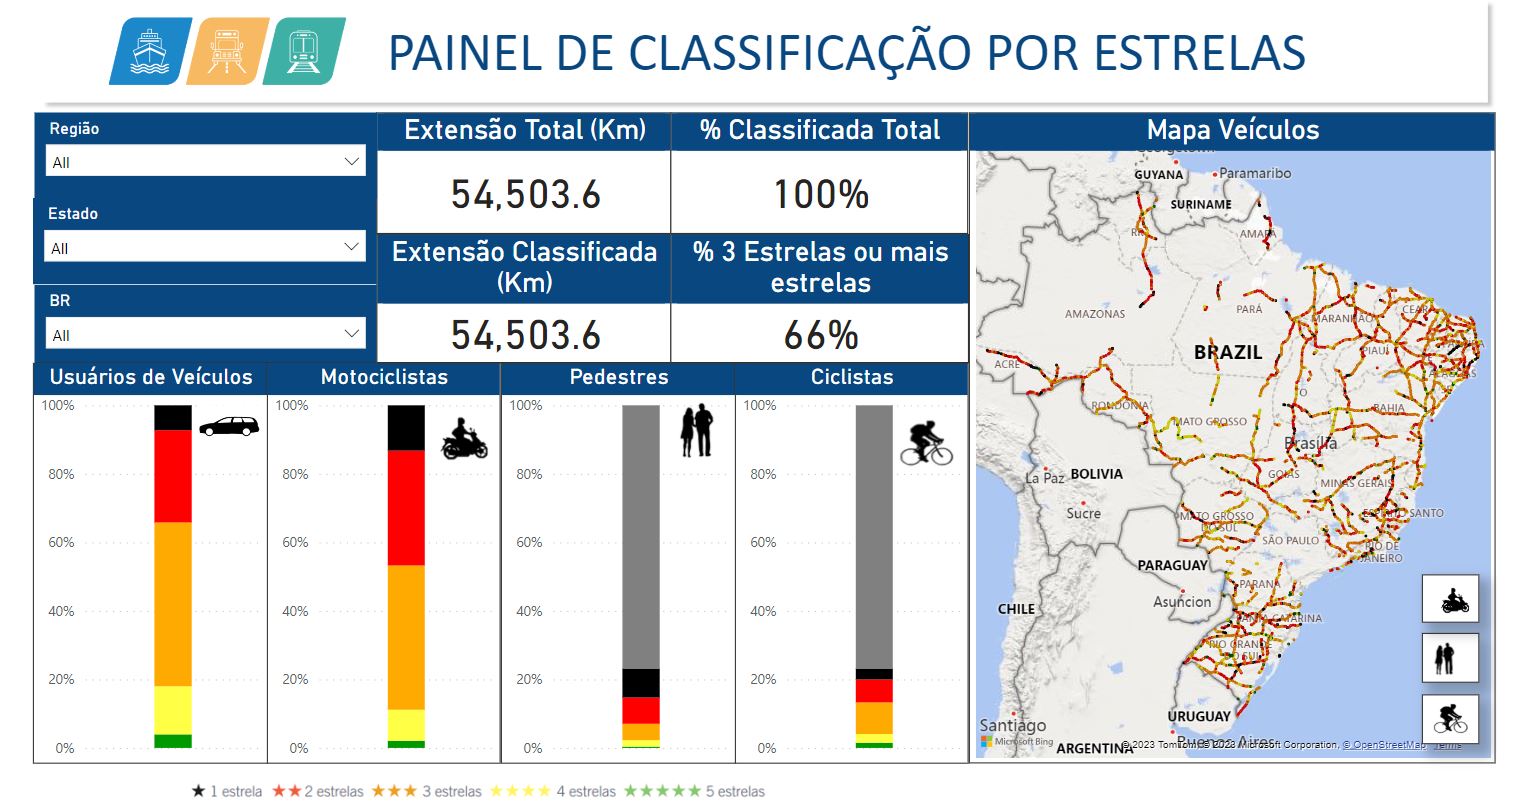
BrazilRAP Power BI results dashboard
Brazil’s National Department of Transport Infrastructure (DNIT) is harnessing and sharing iRAP assessment data alongside local crash and fatality data in Brazil.
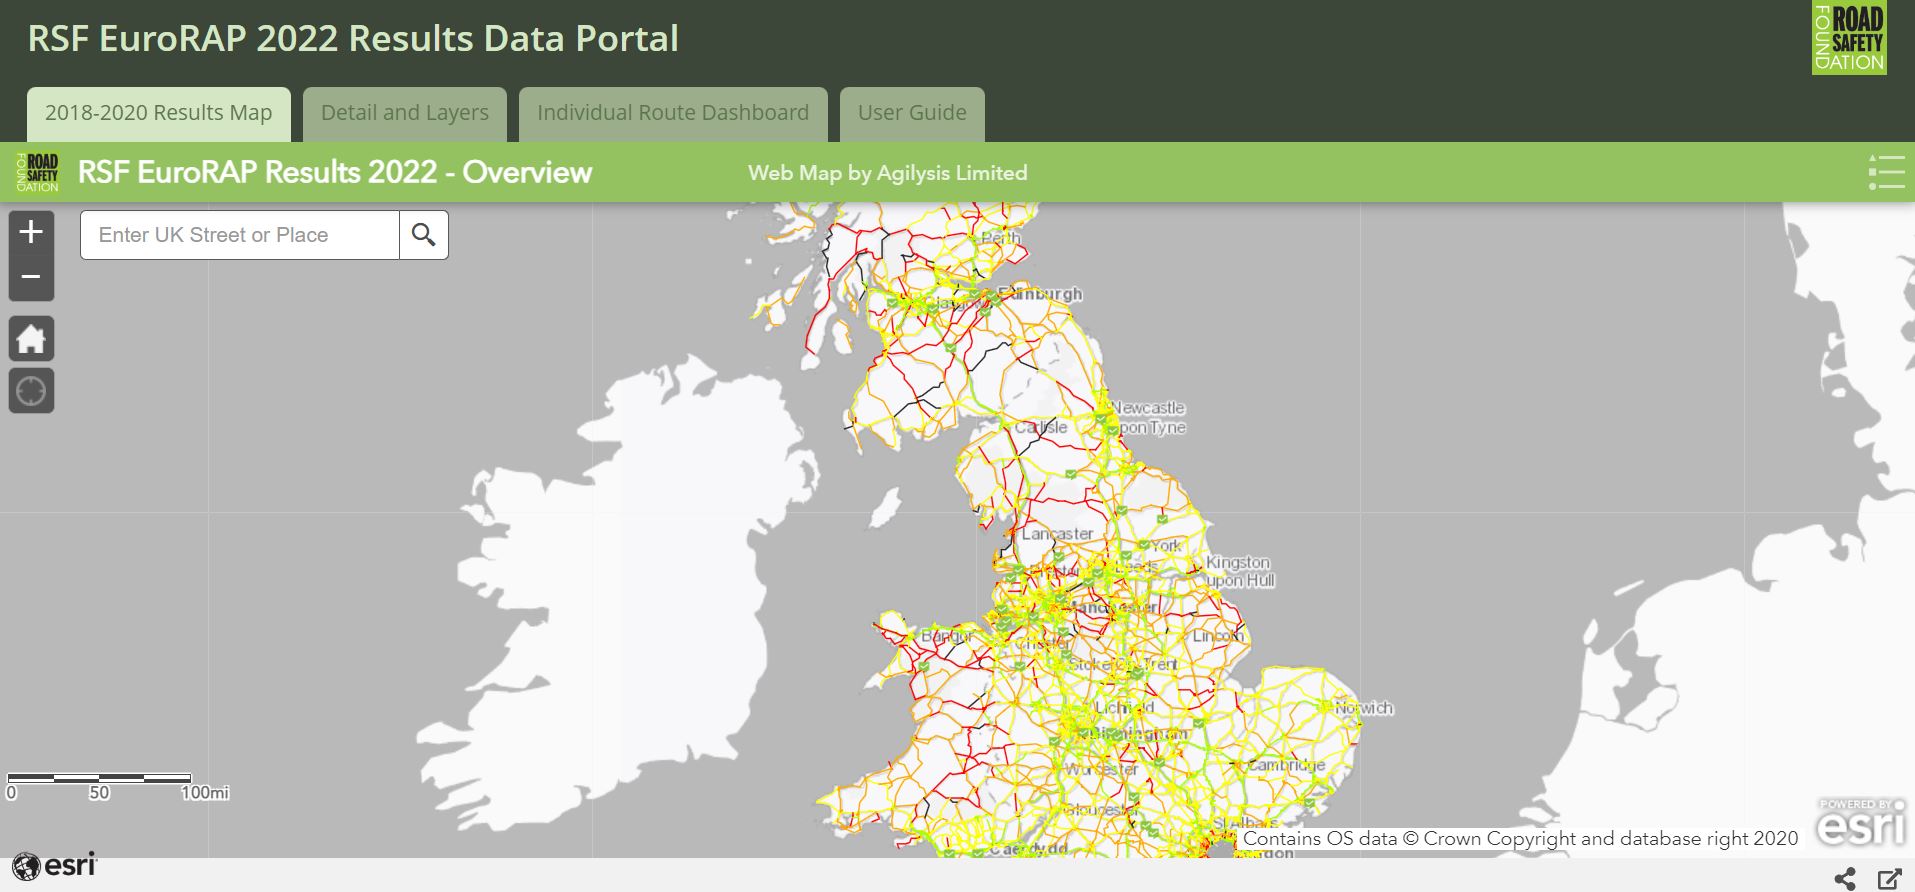
United Kingdom RAP: Road Safety Foundation report
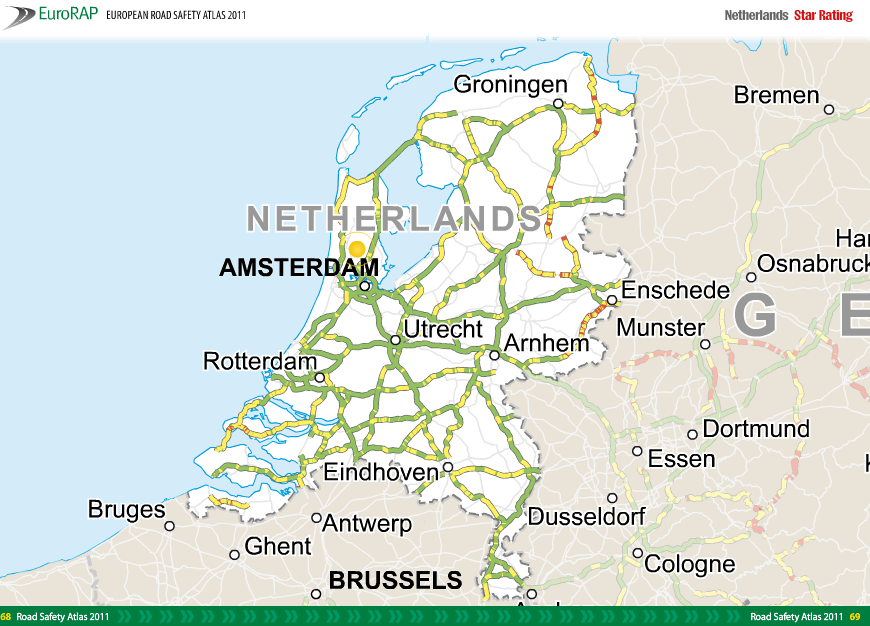
These Road Safety Foundation web maps show the statistical risk of a serious or fatal injury occurring on Britain’s motorway and ‘A’ road network.
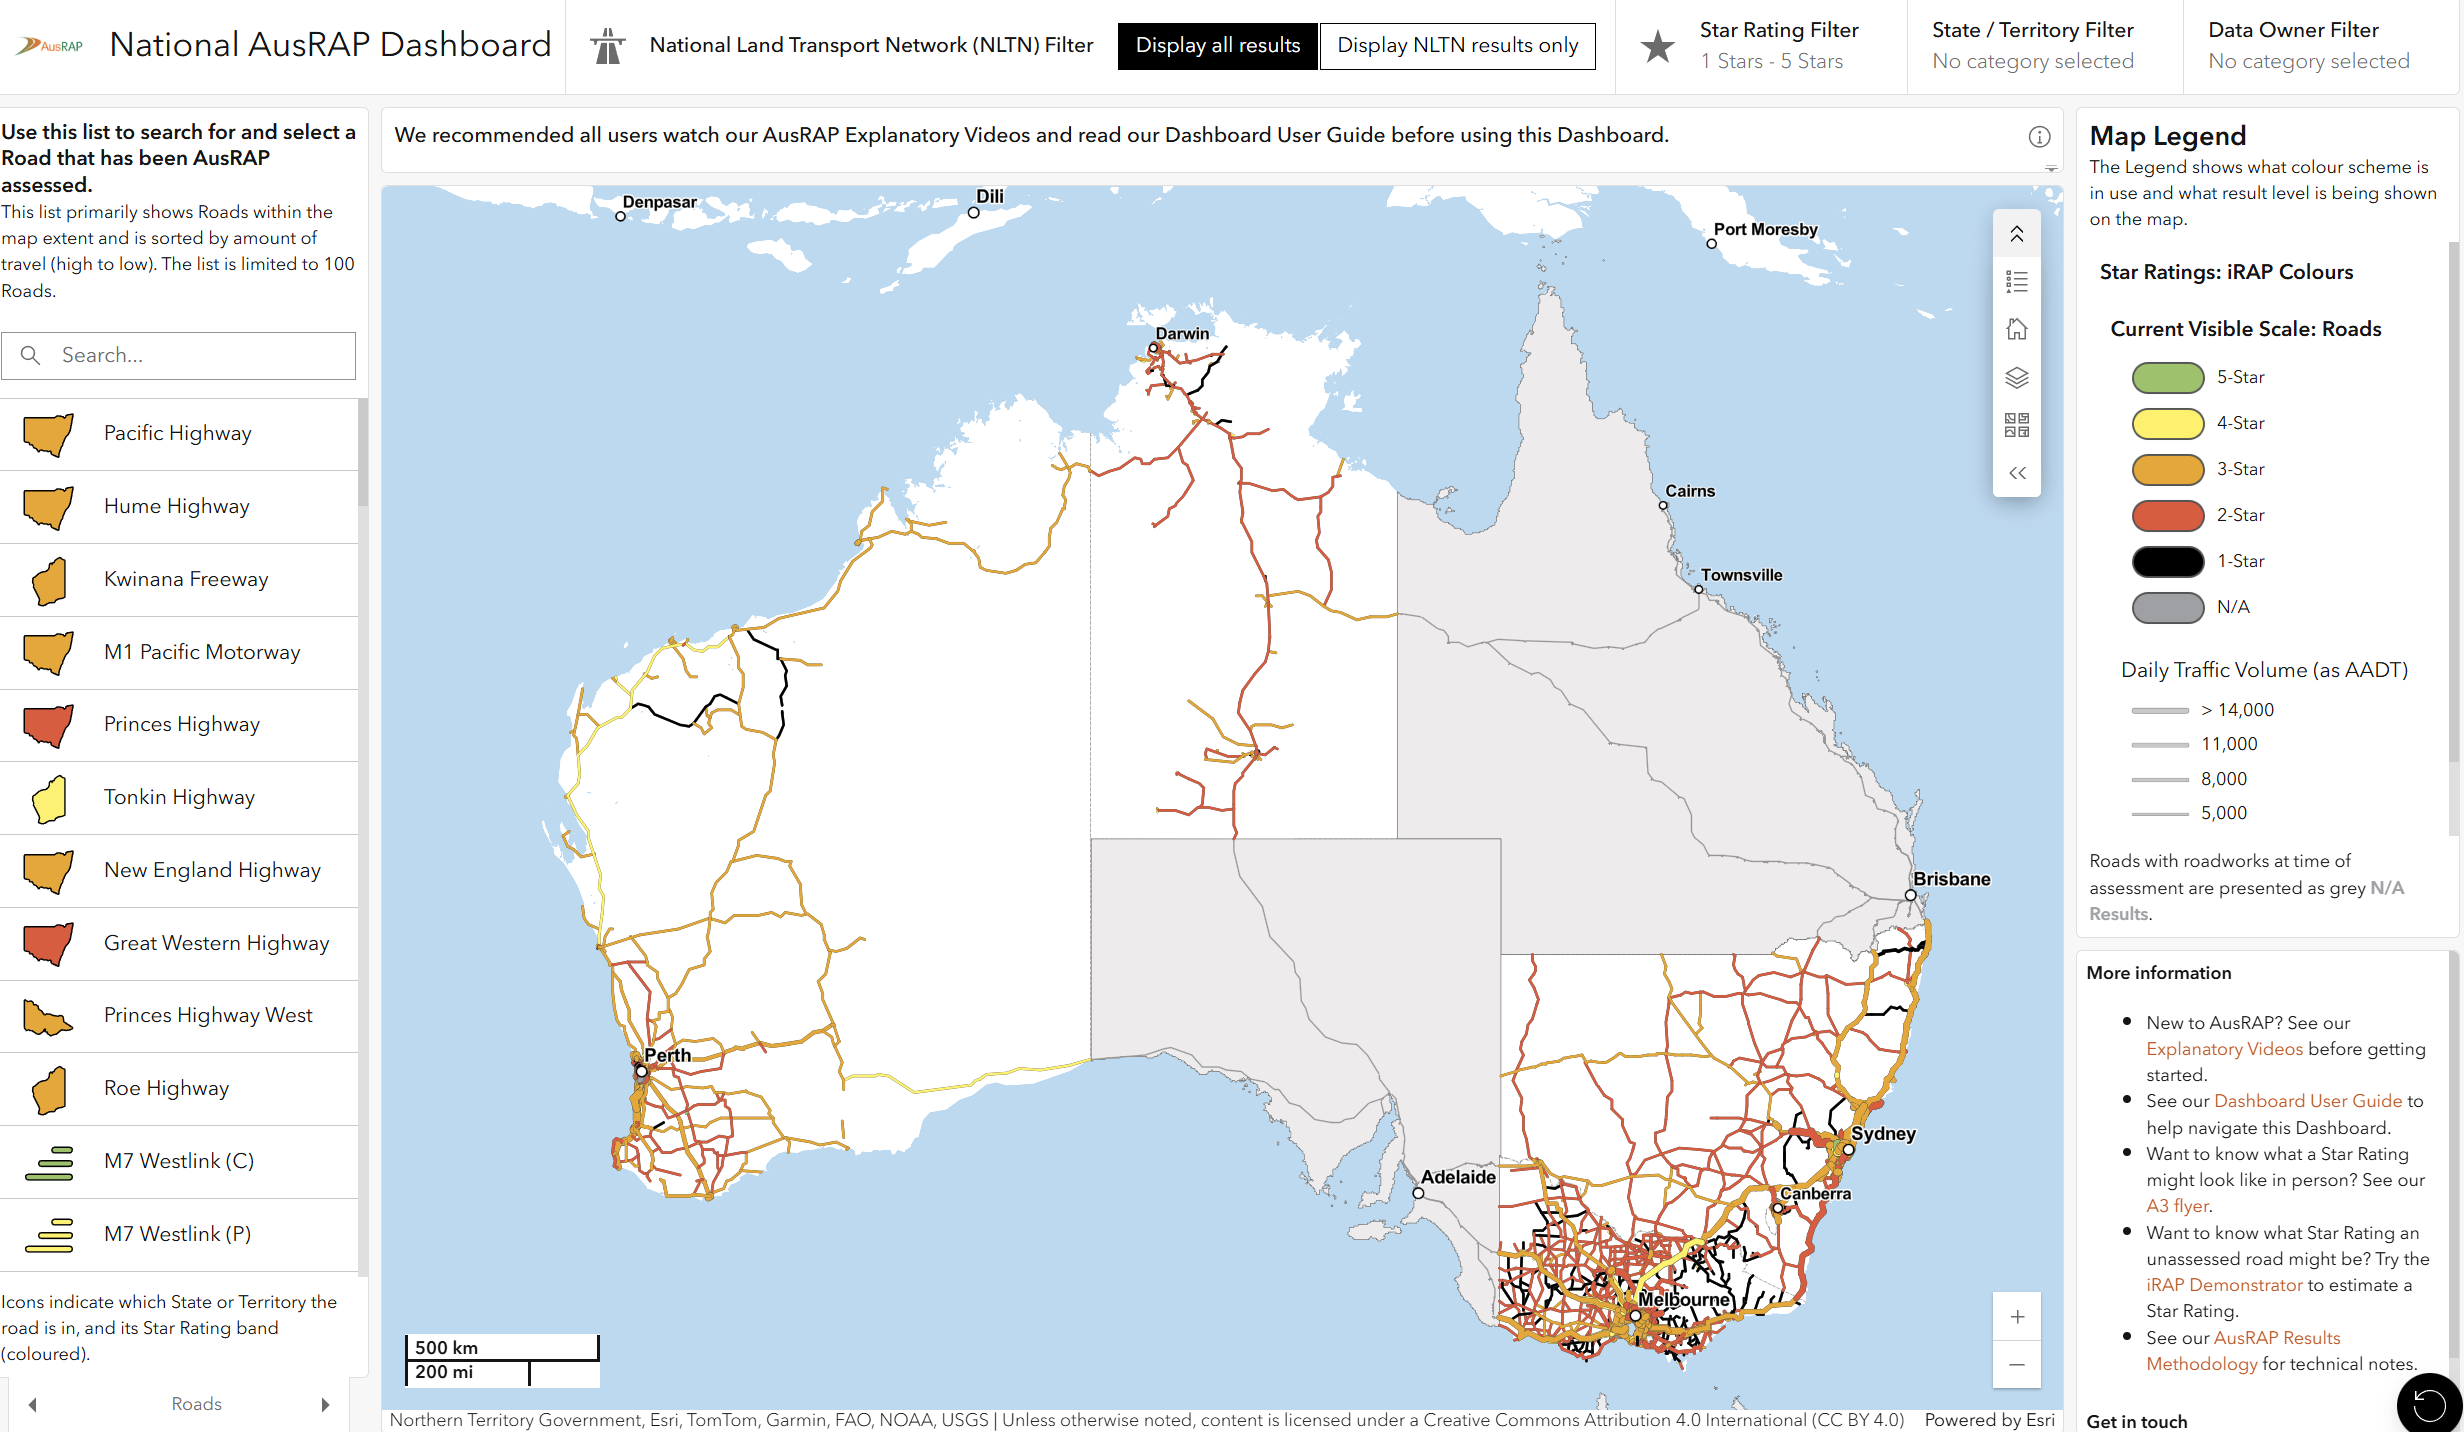
National AusRAP Dashboard (Australia)
The AusRAP dashboard illuminates the safety of roads in five states and territories of Australia – New South Wales (NSW), the Australian Capital Territory (ACT), Victoria, Western Australia and the Northern Territory – according to the iRAP/AusRAP methodology, including Star Ratings, traffic estimates and records of road fatalities and serious injuries. The comprehensive site also includes explanatory videos, case studies and a dashboard user guide.
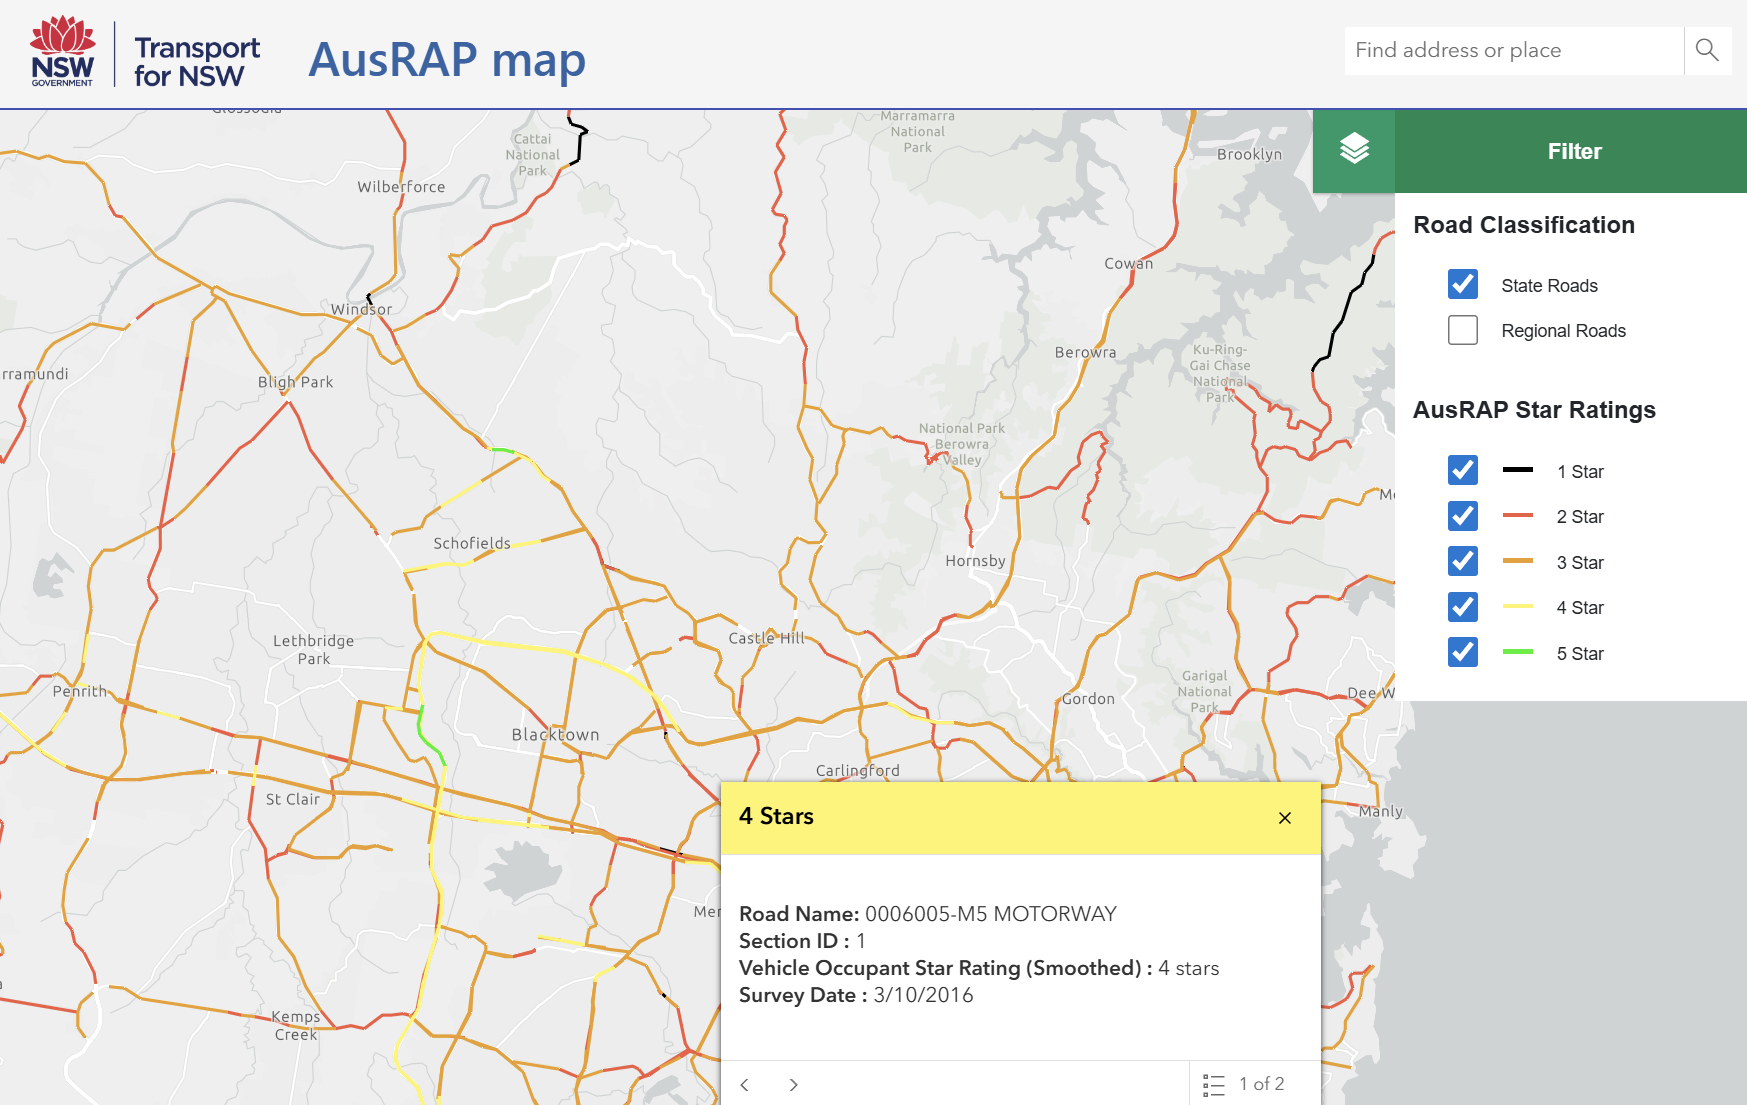
New South Wales' Star Rating Map (Australia)
Australia’s New South Wales’ (NSW) Government is taking a major step forward in building a safer road network across the state, releasing this interactive digital map in July 2025 showing the safety star ratings of more than 20,000 km of state and 15,000 km of regional roads.
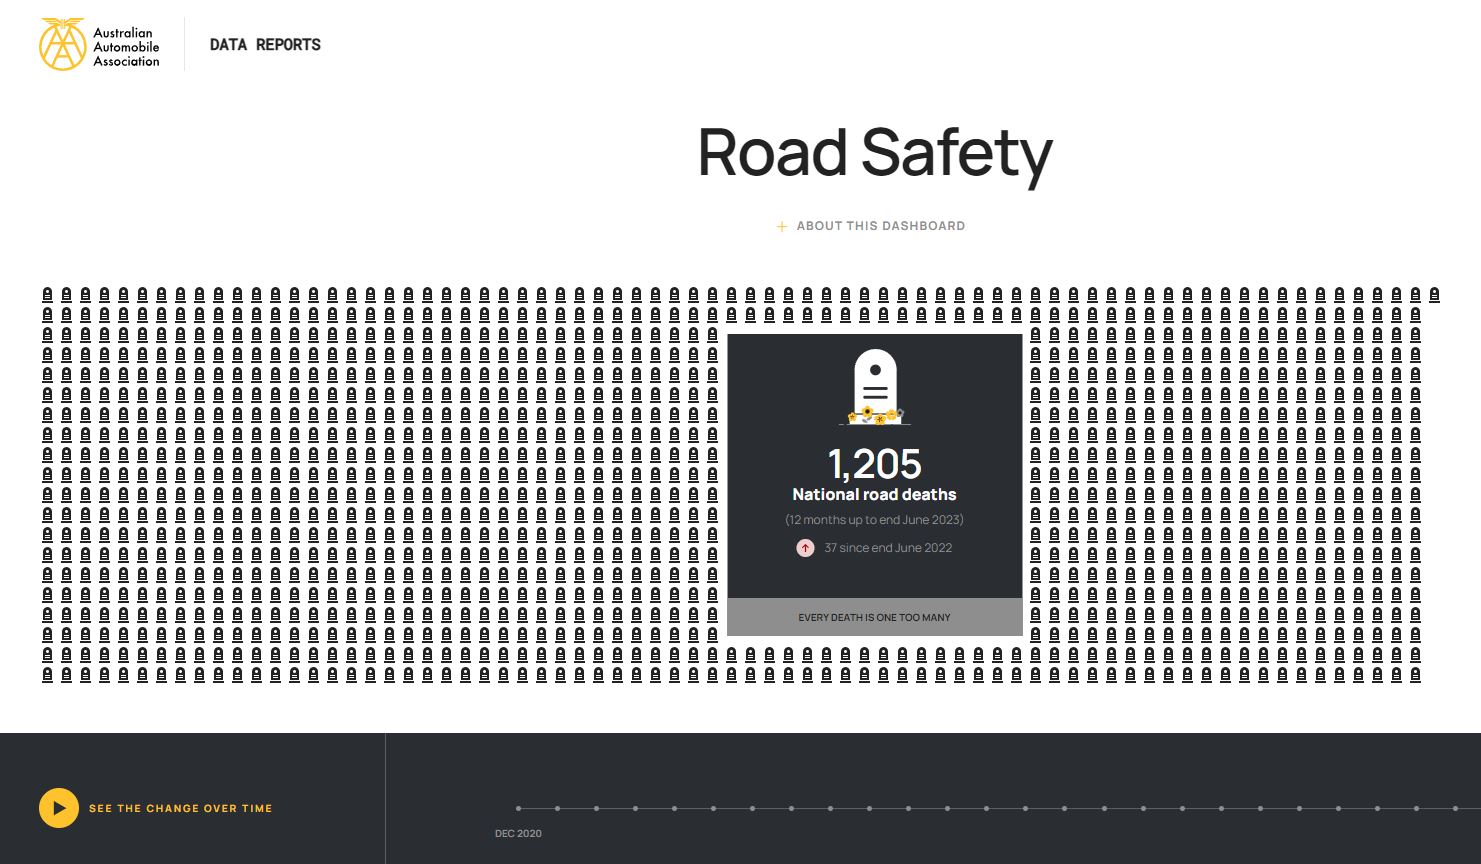
AusRAP: AAA Road Safety Data Dashboard
From the Australian Automobile Association: This dashboard benchmarks the performance of the Commonwealth Government’s National Road Safety Strategy (NRSS) 2021-2030. Data is sourced from the Bureau of Infrastructure and Transport Research Economics (BITRE).
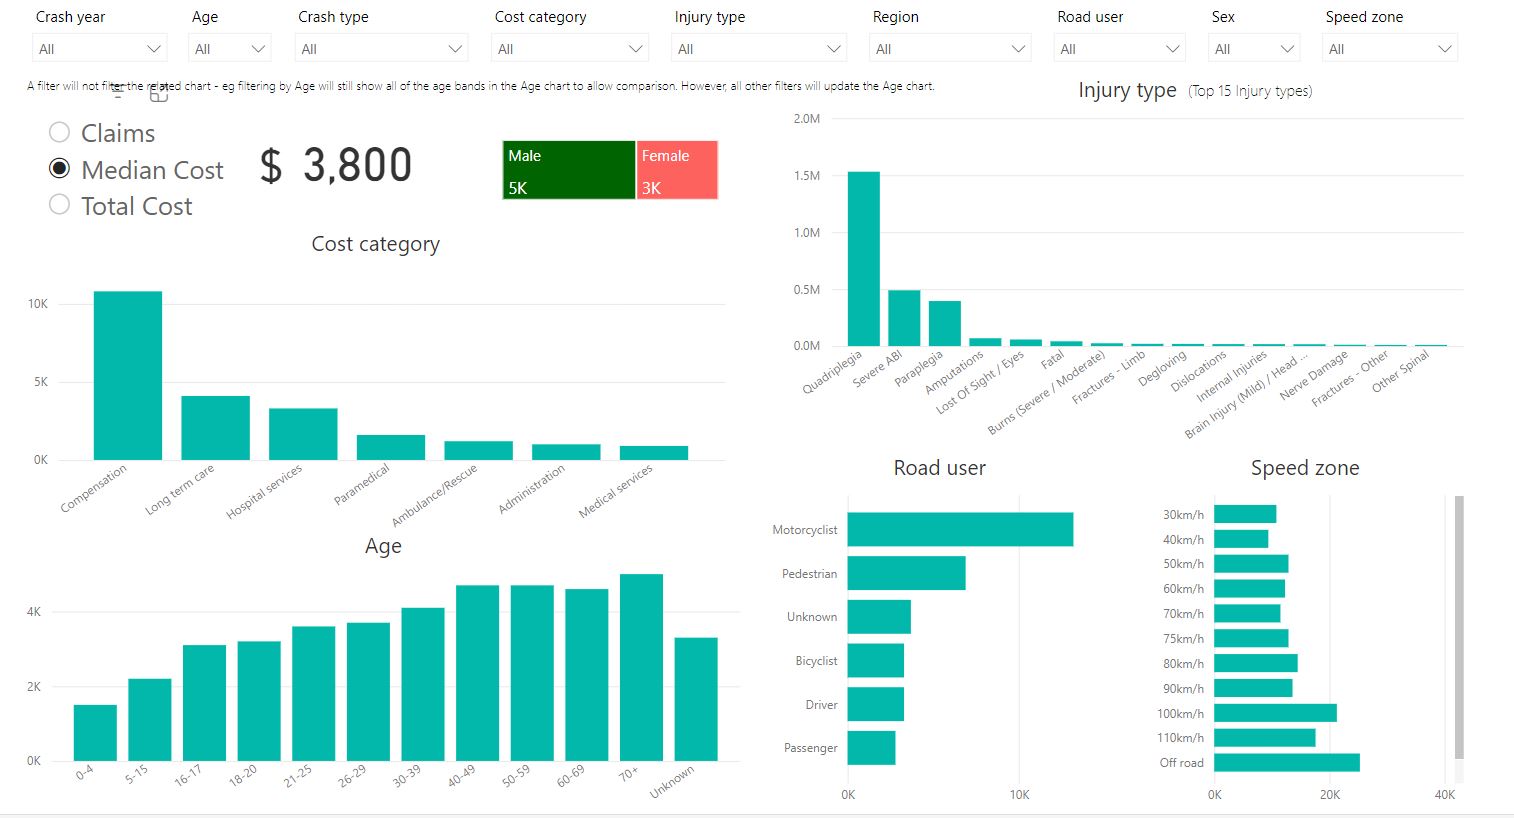
AusRAP: TAC iRAP Road Injury Dashboard
The Transport Accident Commission (TAC) iRAP injury data provides a unique insight into the injury types, crash types, road types and road user types involved, along with the total life-time claim costs that result from those injuries. The dashboard also highlights where in the health sector the costs fall and when those costs occur. The TAC – iRAP Road Injury Dashboard is designed to shine a spot-light on the real cost of road trauma.
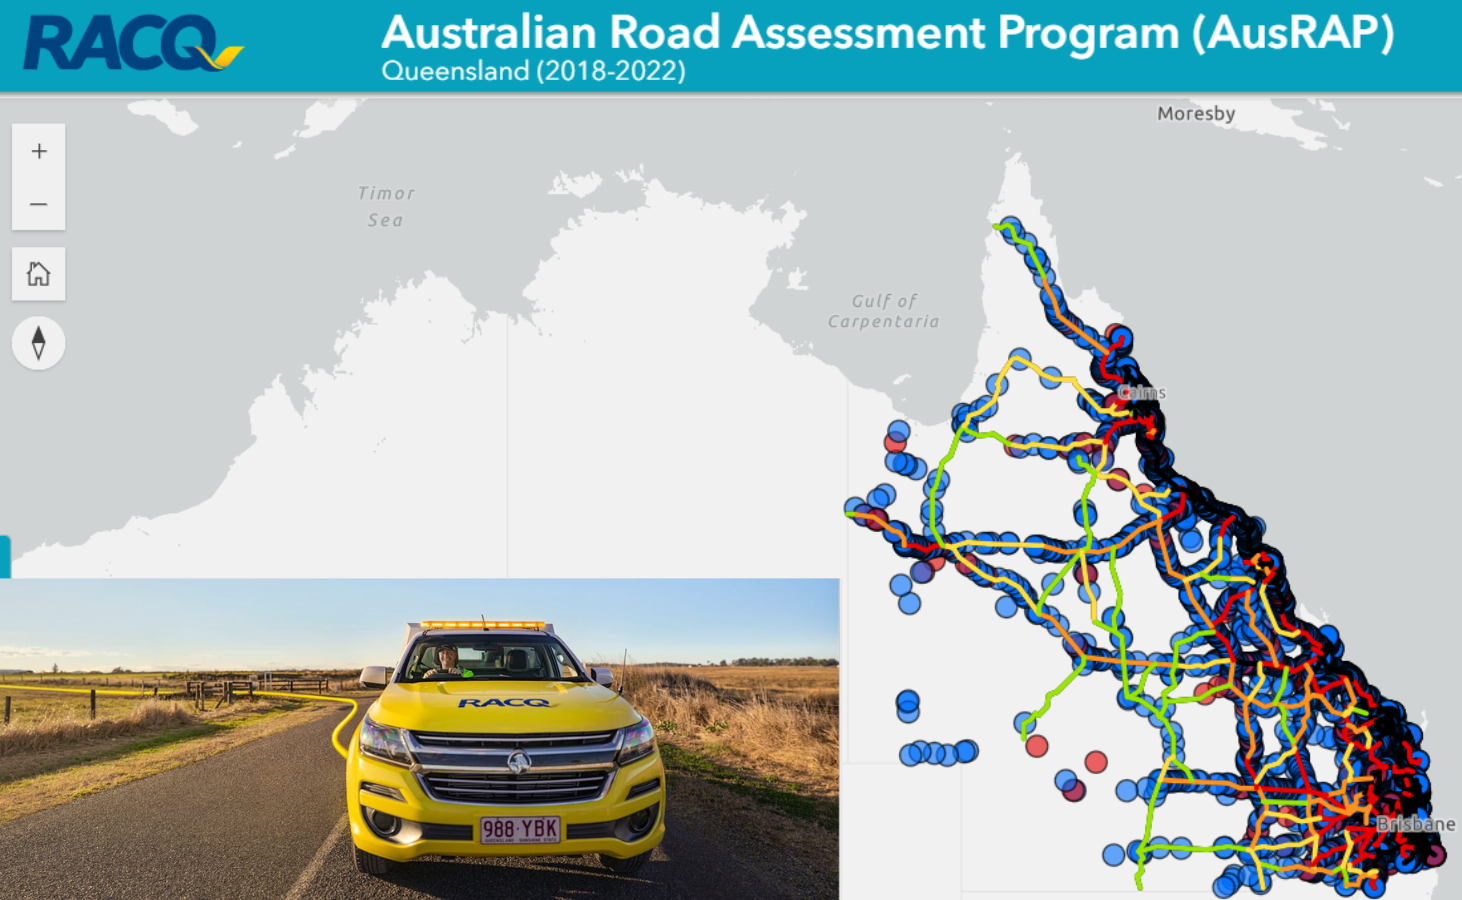
AusRAP risk ratings for roads in Queensland
This report produced by RACQ enables you to explore the AusRAP risk ratings for roads in Queensland, Australia
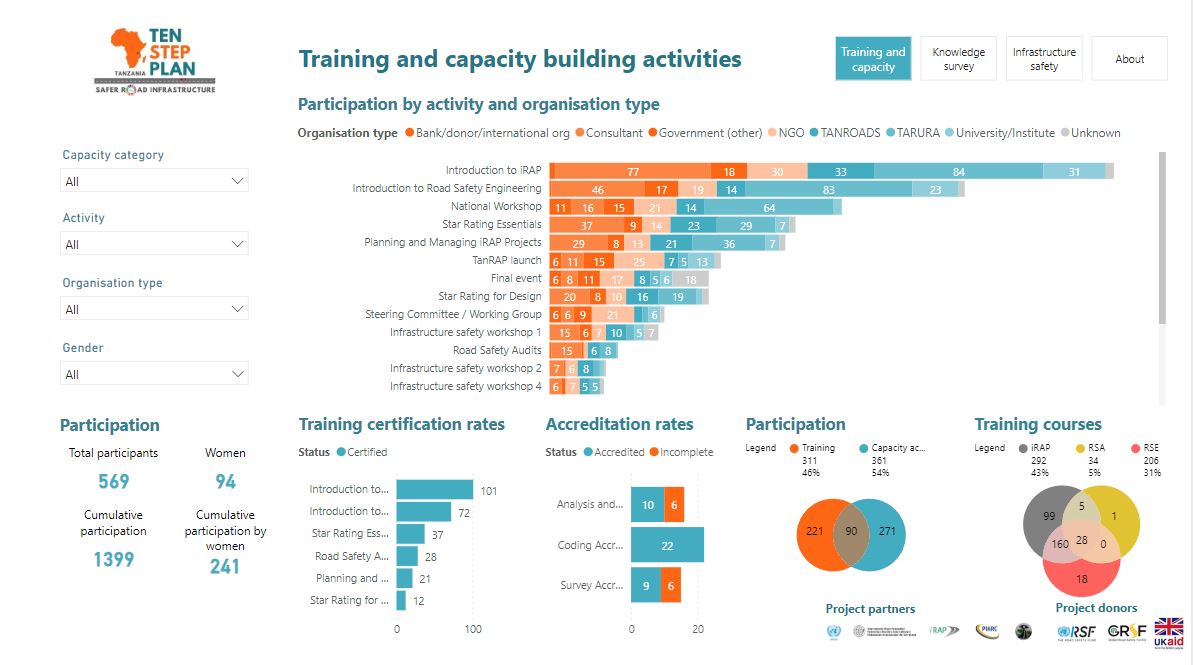
TanRAP: Tanzania Ten Step Plan Insights
This dashboard was developed as part of the iRAP Impact Evaluation the UNRSF Ten Step Plan for Safer Road Infrastructure in Improving the Safety Performance of WB’s Projects project, funded by UK Aid through the GRSF.
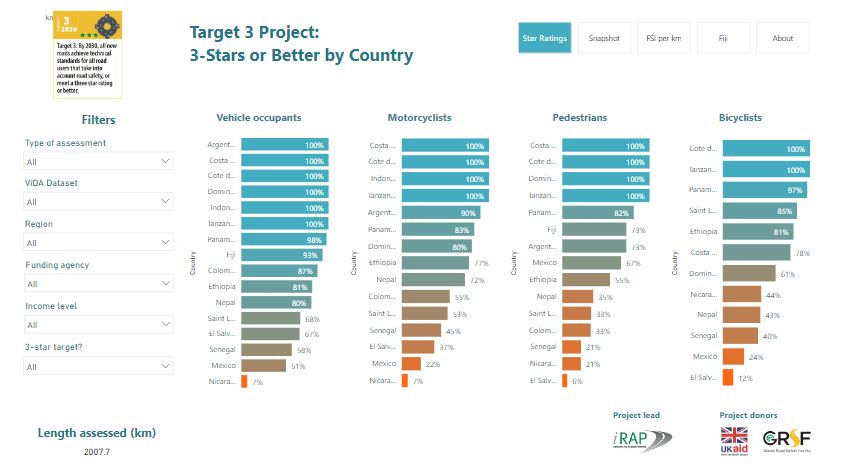
Target 3 Project Dashboard
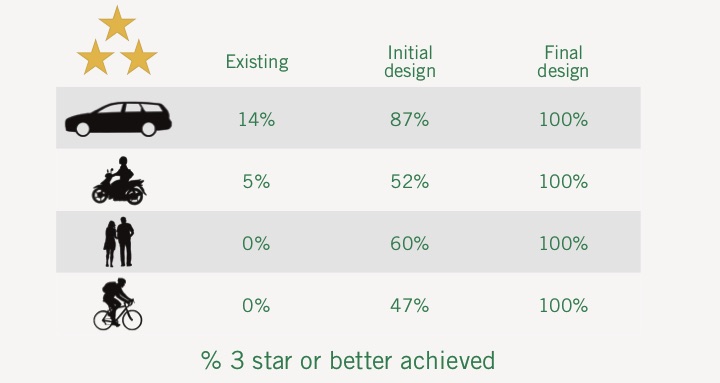
The Target 3 Project analysed over 30 road corridor projects worldwide, totalling more than 2,000km of roads and designs, to examine progress towards ensuring all new roads are 3-star or better for all road users by 2030. The Target 3 Project Dashboard enables you to explore some of the data in detail.
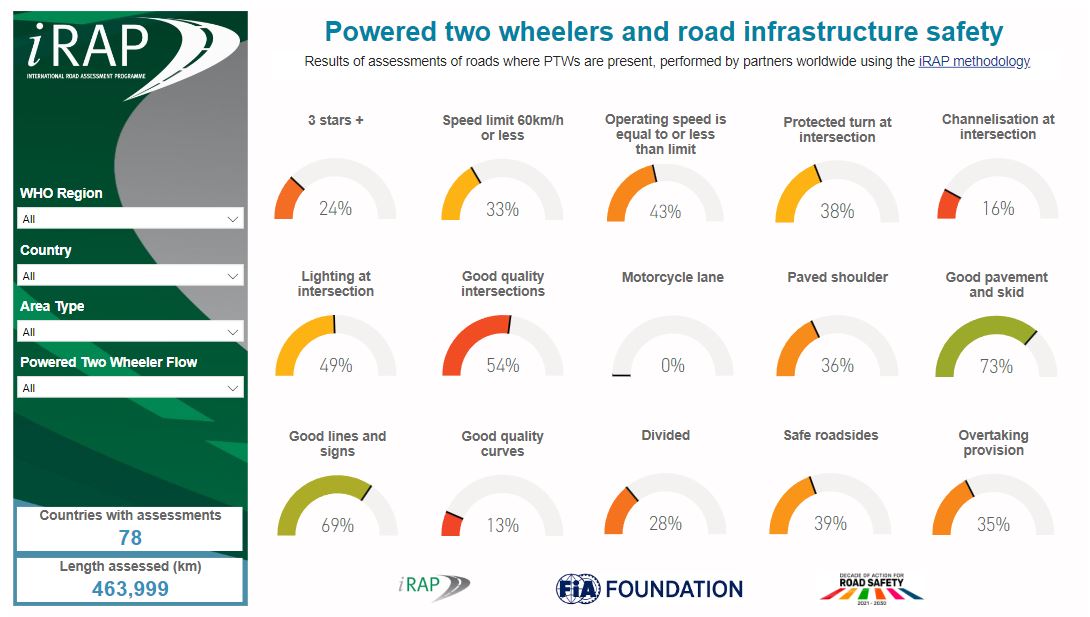
iRAP's Powered Two-Wheeler Insights report
To support discussions on the safety of motorcyclists, this interactive Powered Two-Wheeler Insights report is now available (originally released to accompany the Asia Pacific Road Safety Observatory Annual Meeting)
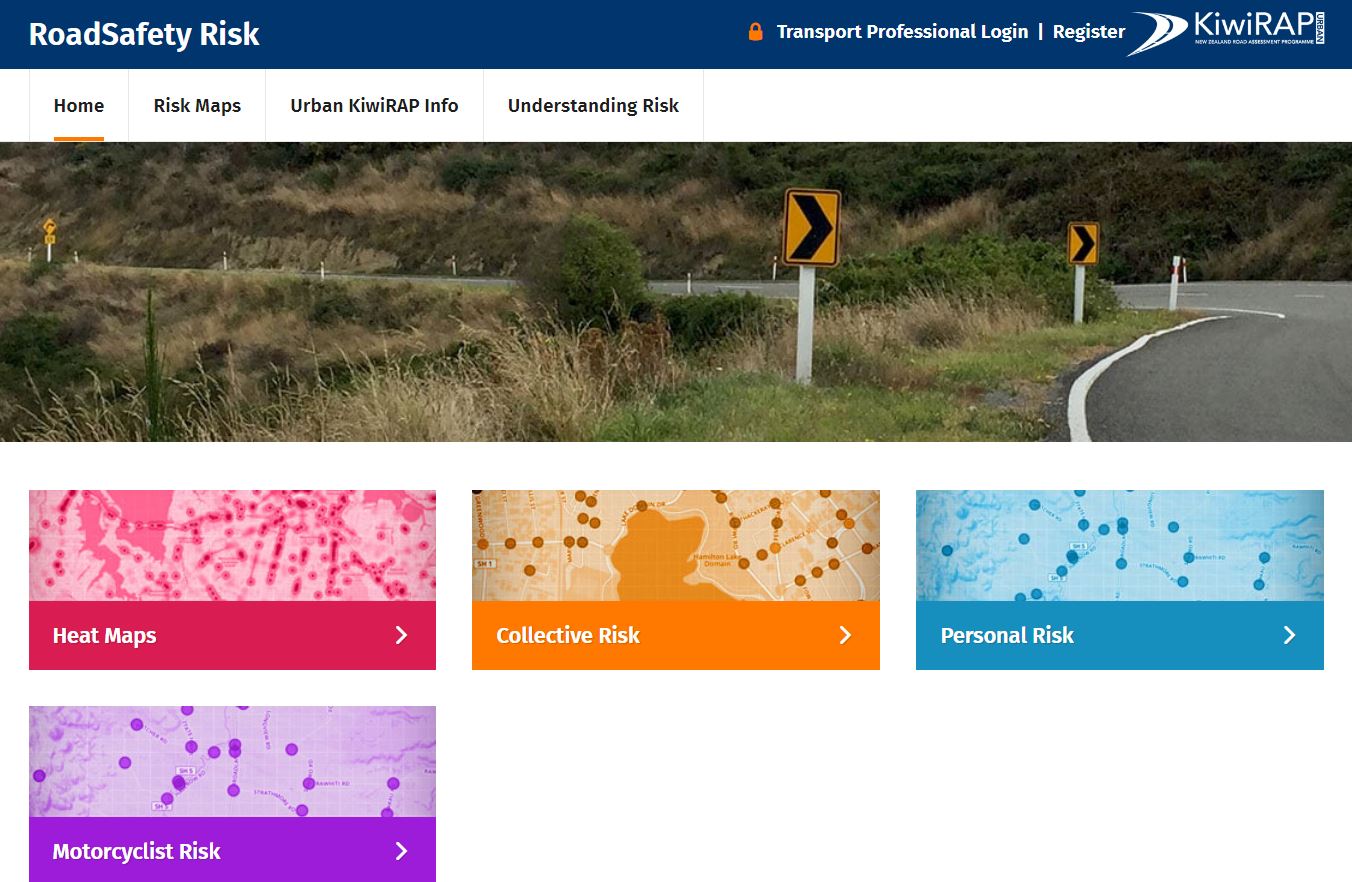
KiwiRAP: RoadSafety Risk NZ dashboard
The roading network data held on this website has been developed as part of Safer Journeys, New Zealand’s road safety strategy to 2020. Urban KiwiRAP contributes to the Safe System goal of improving the safety of roads and roadsides to reduce the likelihood of crashes occurring and to minimise the consequences of crashes if they do occur.
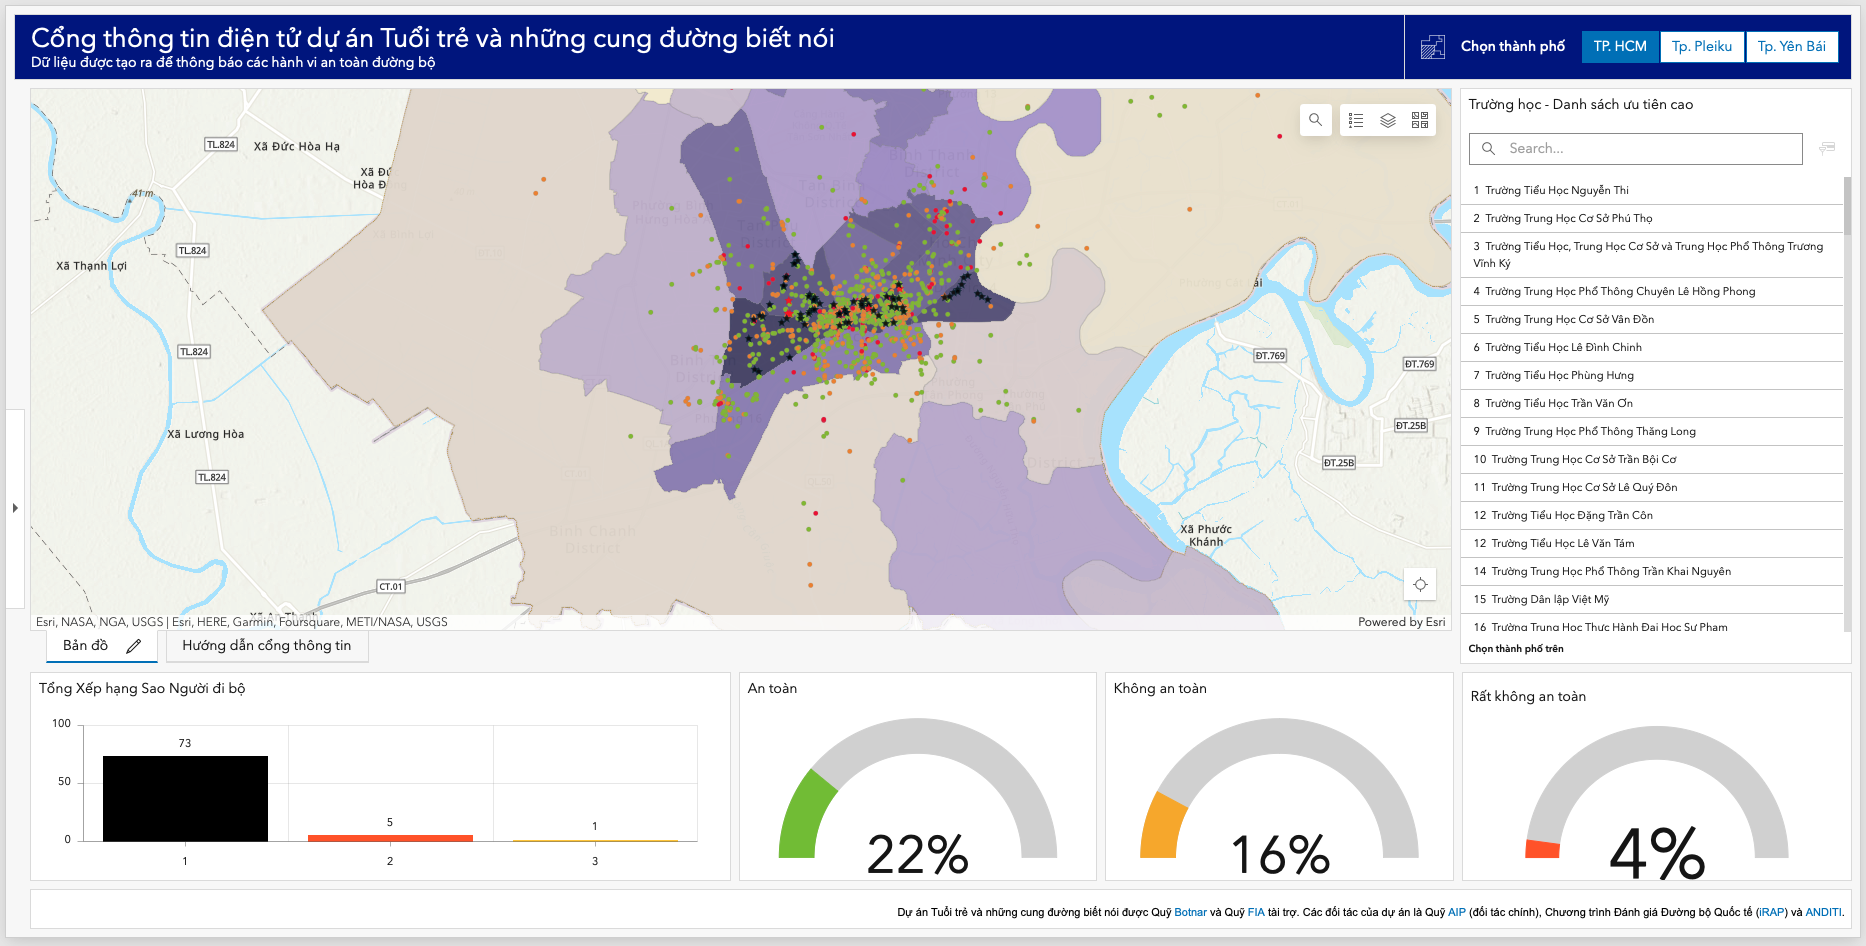
AI&Me - Citizen Portal
This dashboard was developed as part of the AI&Me: Empower Youth for Safer Roads project funded by Fondation Botnar and FIA Foundation.
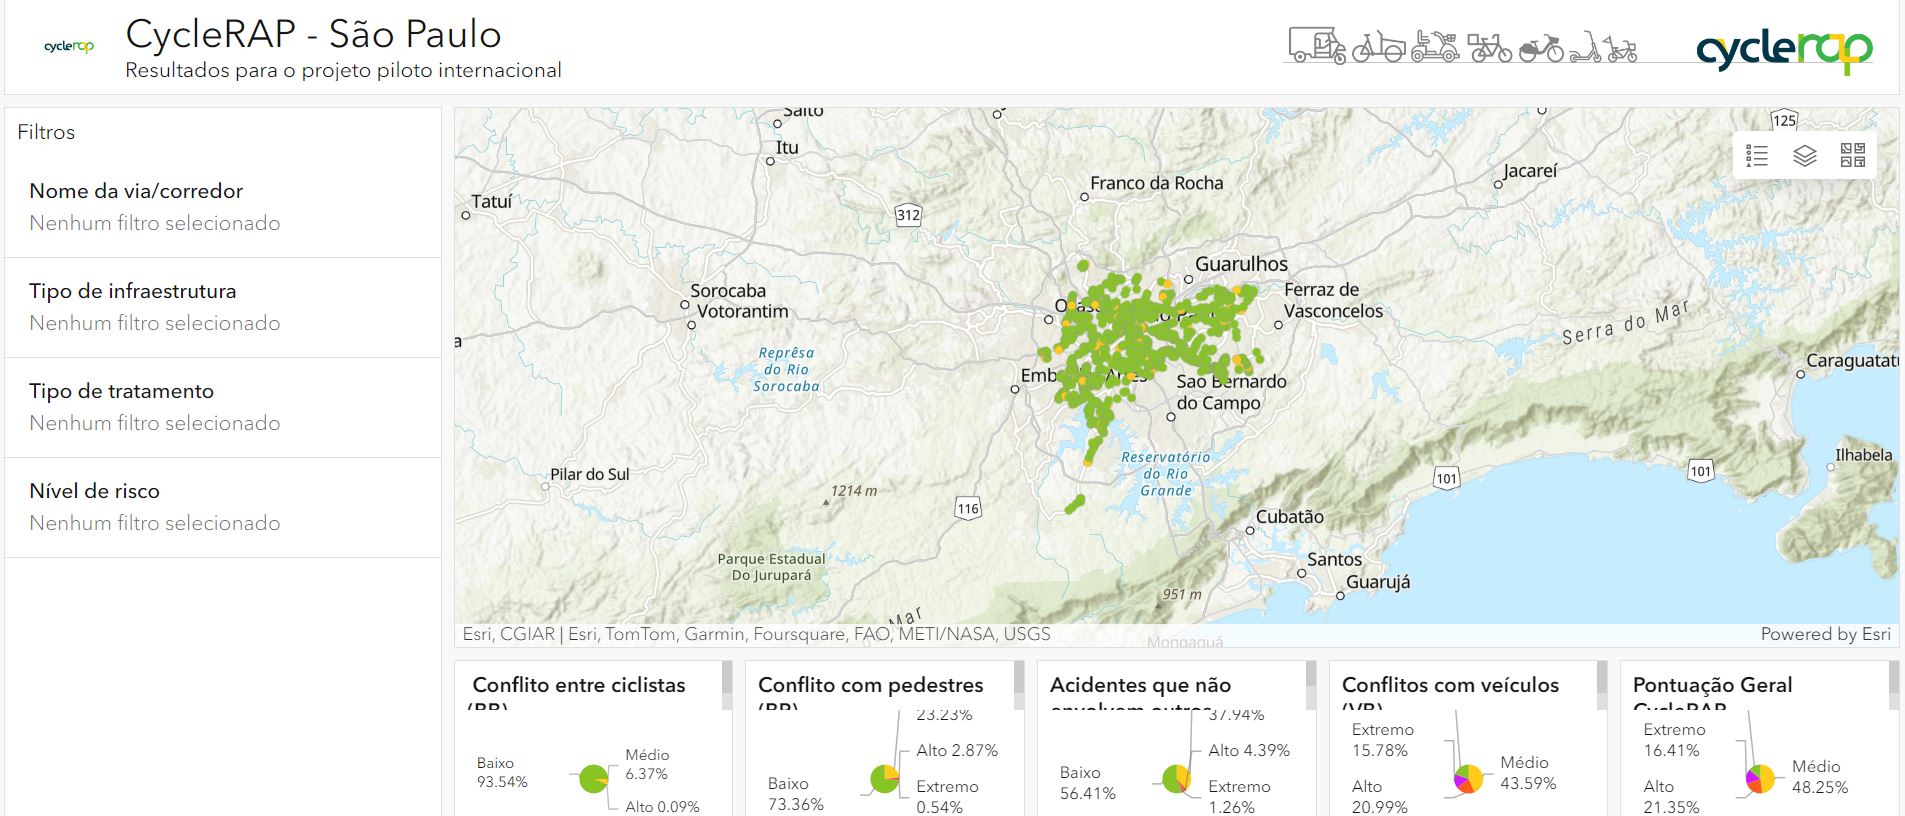
CycleRAP Results Dashboard - São Paulo, Brazil
This dashboard was developed to present CycleRAP results to the city of São Paulo, Brazil. The project was funded by Fundación Mapfre, UCI and PTV Group
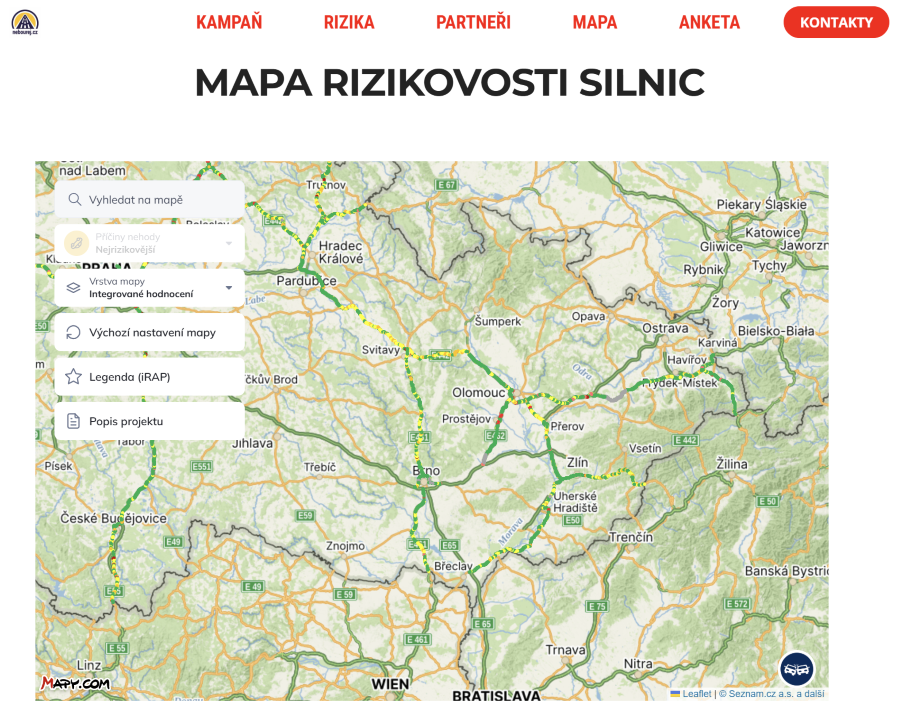
Czechia Star Rating Results & UAMK Reducing Accidents Campaign Dashboard
This dashboard presents iRAP Star Rating results for Czechia’s “Reducing Accidents Through Internationally Recognized Methods” Project and Campaign conducted in 2024 as a partnership of UAMK, iRAP, AFRY and Data Friends, supported by Czech Insurers Office (CKP) through the Damage Prevention Fund (FZS).


