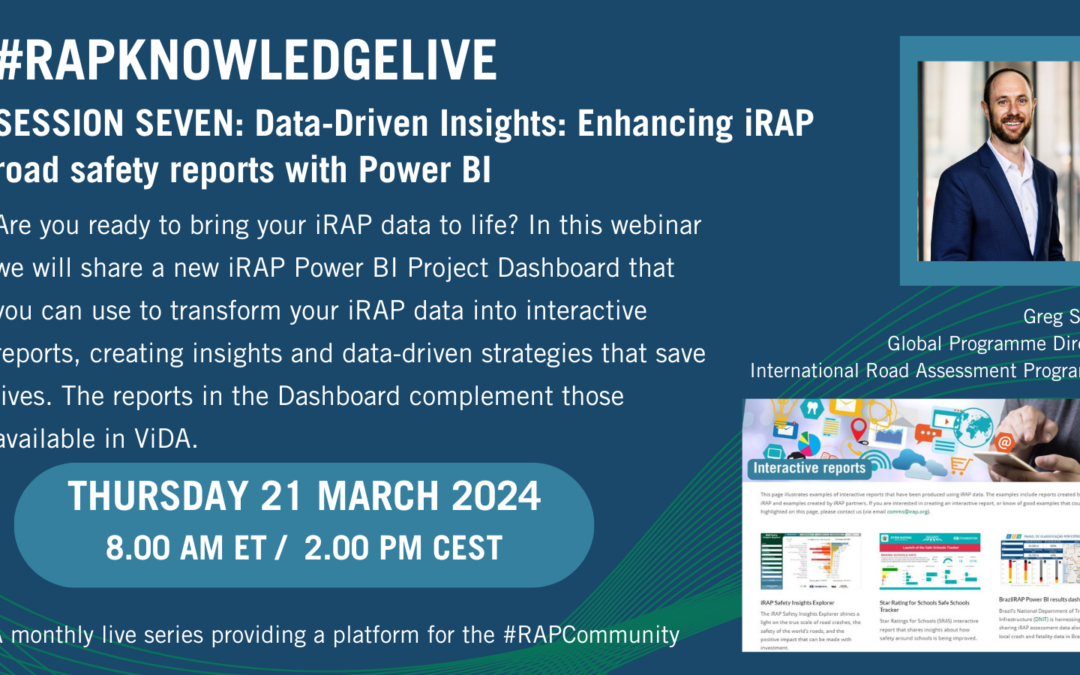
Didn’t catch the #RAPKnowledgeLive Session 7: Data-Driven Insights: Enhancing iRAP road safety reports with Power BI? No worries, the recording is here for you!
Turn Your Data into Life-Saving Strategies
This session, held on Thursday March 21, saw a great turnout with approximately 95 participants from 47 countries joining us for the first #RAPKnowledgeLive of 2024. We unveiled the iRAP Power BI Project Dashboard – designed to transform your iRAP data into interactive reports, empowering you to generate insights and data-driven strategies that ultimately save lives. These reports seamlessly complement those already available in ViDA.
What You’ll Learn:
- Accessing and Connecting: We’ll guide you through accessing the iRAP Power BI Project Dashboard and effortlessly connecting it with your iRAP data.
- Ready-Made Insights: Explore a library of interactive reports for analyzing road safety data, encompassing Star Ratings, road characteristics, and investment plans.
- Actionable Applications: Discover practical ways to utilize the Dashboard, including publishing your reports online to share valuable insights with stakeholders.
Watch the Recording: Access the recorded session here
Find Out More:
To learn more about the iRAP Power BI Project Dashboard, head over to our Interactive Reports page.
Looking for Additional Training?
For those interested in catching up on past #RAPKnowledgeLive sessions or exploring other training resources offered by iRAP, visit the training section on our website: irap.org/training
Other useful links referenced in session:
- Power BI Desktop: Microsoft Power BI Desktop download: https://powerbi.microsoft.com/en-us/downloads/
- ViDA login: https://vida.irap.org

