As a woman working in transport, I’m aware of how big an issue gender is. It’s not a theoretical or abstract concept for me. I have experienced first-hand the challenges of trying to get from A to B, often via C, D and sometimes E as a pedestrian, bicyclist, public transit user, driver, passenger, on my own, at night, during the off peak, with kids in tow, with two suitcases and kids in tow… you get the picture. Too often, the transport system feels like a hostile environment that was not created with people like me in mind.
For women, safety is often the first and foremost consideration in deciding when, where and how to travel. If I take my bike with a child, is there a safe facility I can ride on? If I walk at night, do I risk not being seen on roads where there’s no footpath. If I catch public transit, am I risking my personal safety? Is there streetlighting? It’s the unfortunate reality that in places I live, I am too often forced to select a mode of transport that creates toxic emissions, gives me motion sickness and which costs more because of a lack of safe and convenient means to walk, use my bike or take public transit.
But I am privileged. I have a driving license and access to a vehicle when I need it. Globally, women are far less likely than men to drive, have a licence or a vehicle due to a range of reasons. In many places, car use and ownership are luxuries many cannot afford. Yet despite this, our roads are built to prioritise the comfort, convenience and safety for the privileged few in cars to the detriment of everyone else. In doing so, studies—such as this one in India—find that women and girls see a significant proportion public spaces as highly gendered, ‘frightening’, and to be avoided if possible. This issue doesn’t just affect women of course, it affects children, the elderly, the poor.
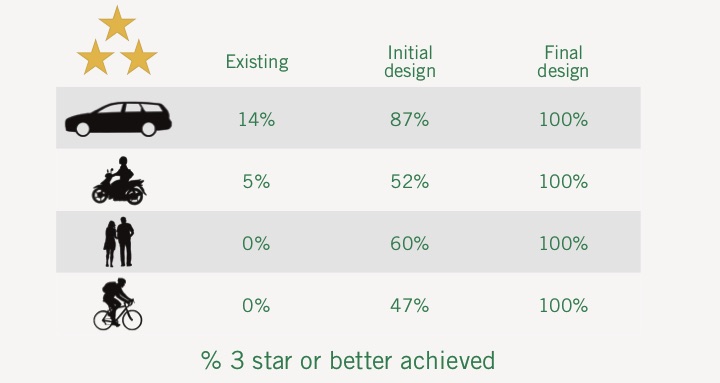
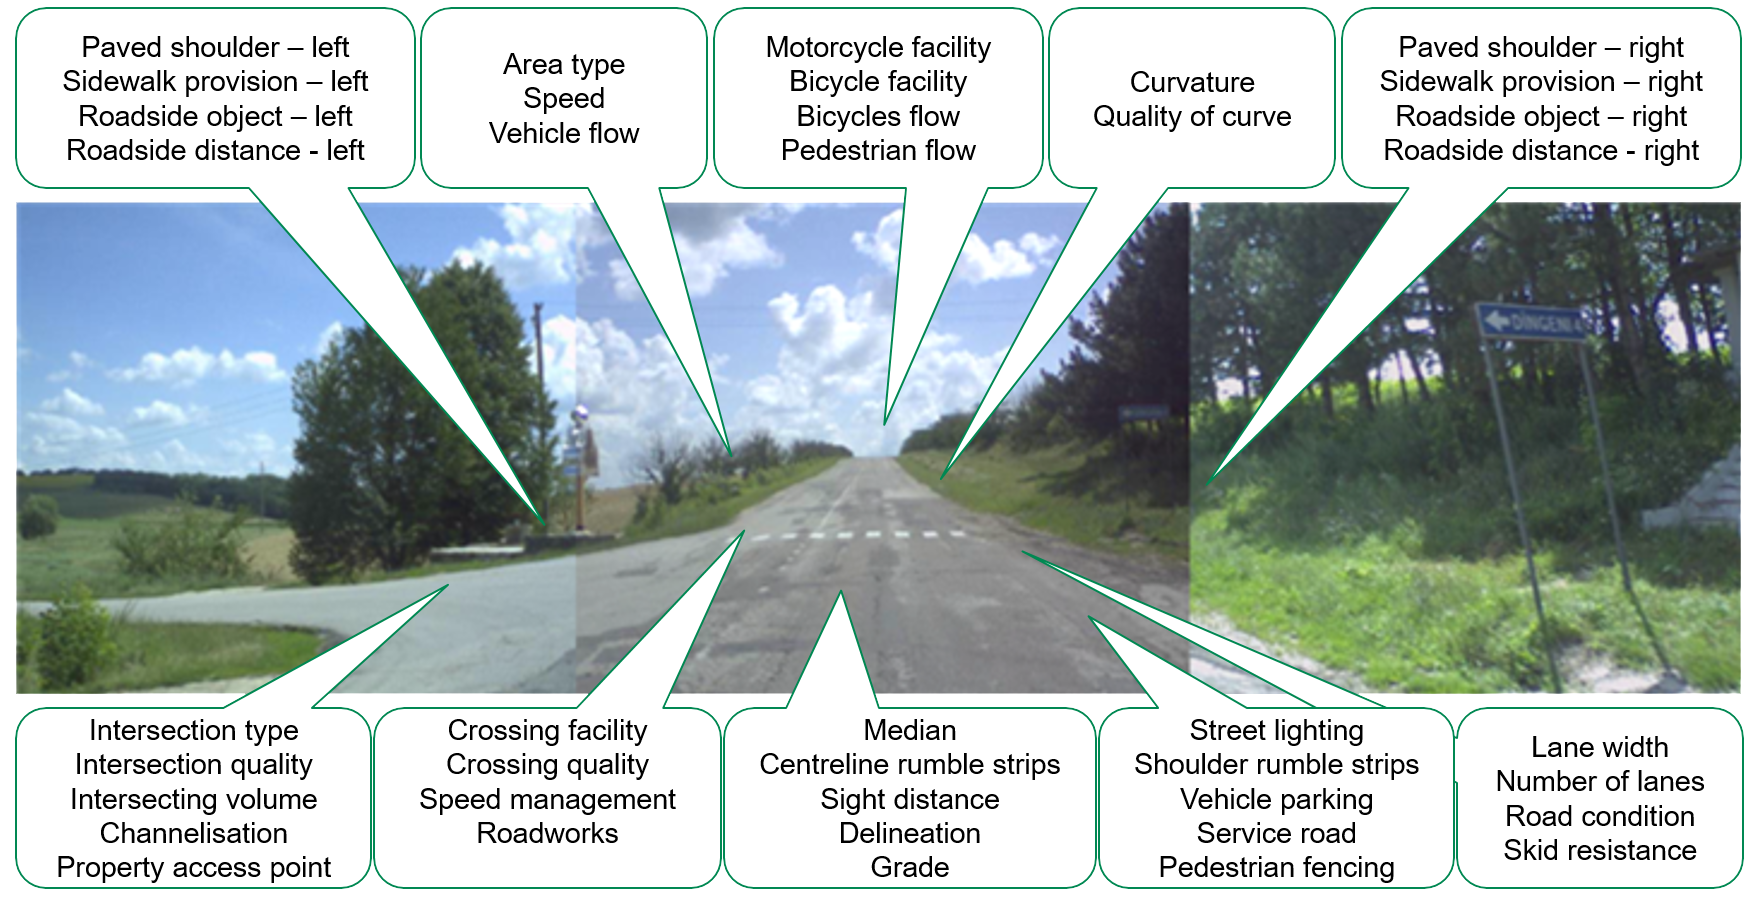
iRAP is a small but global NGO working to reduce traffic-related deaths and serious injuries. iRAP’s road safety assessment method, which gives a road a safety Star Rating, aims to address infrastructure-related risk by giving roads individual Star Ratings for four road user groups—pedestrians, bicyclists, motorcyclists, and vehicle occupants. This method, which has now been used in over 100 countries, makes it very hard to ignore the safety of other road user groups in the design of our roads and streets.
It has been tremendously successful. Approximately three million kilometers of roads have been safety assessed or had crash risk mapping completed. iRAP’s method is incorporated into the United Nation’s Global Road Safety Targets and the Global Plan for the Decade of Action for Road Safety 2021-2030.
But here at iRAP, we are not ones to rest on our laurels. Gender inequity in transport remains one of the key challenges to ensuring a safer and more equitable future for our children, and as such, we need to do something about it.
Part of the problem is data, or rather the lack of it. As Caroline Criado Perez argues in her book, Invisible Women, women’s travel patterns and choices are often just that—invisible—meaning road authorities around the world are making critical decisions about transportation infrastructure—decisions which have long-term, often multi-generational, impacts on communities—without taking the needs of everybody into consideration.
iRAP’s method uses a data driven approach to assess the safety of road users. But like anything that relies on data, it is essential we look at this from a gender perspective to better understand the safety of transport for the modes women use.
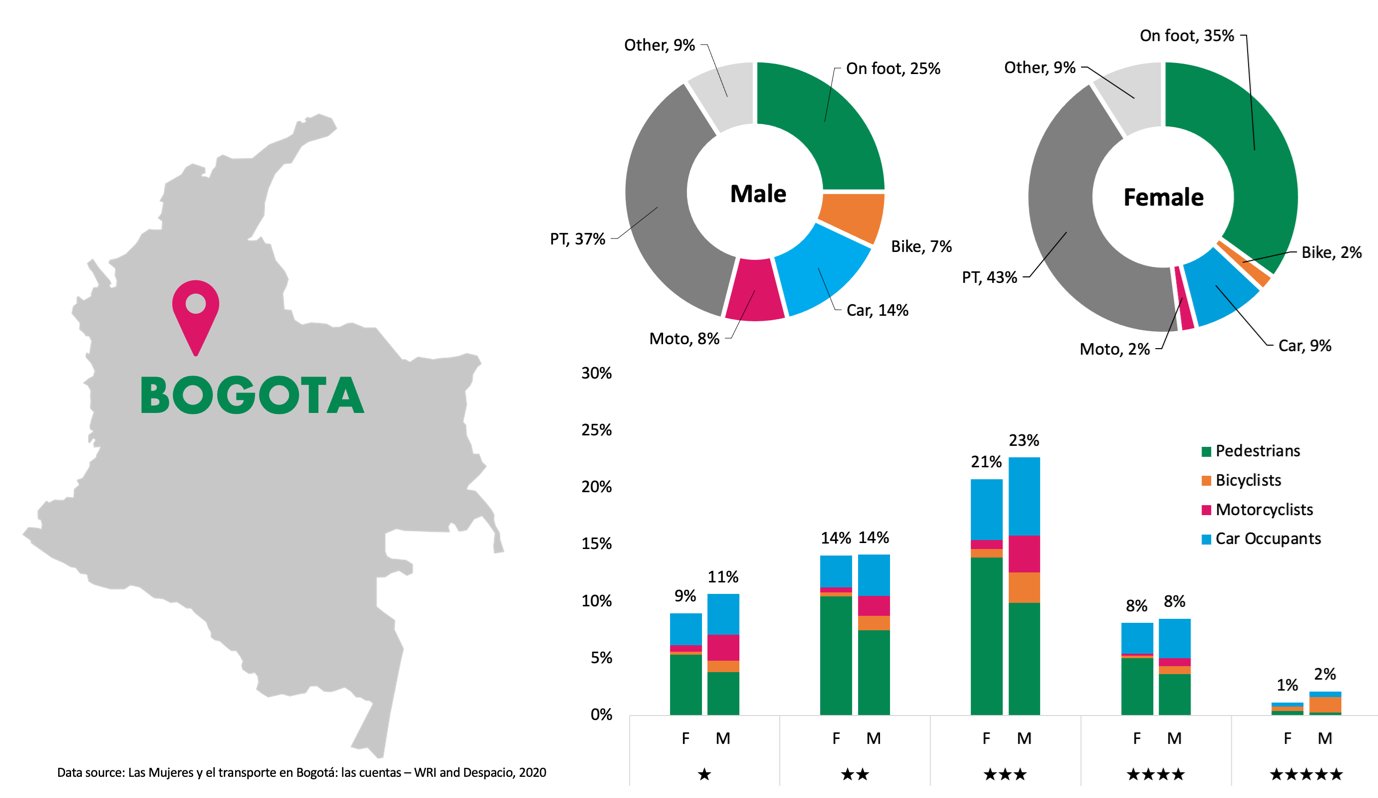
We looked at a sample of cities which completed iRAP assessments with the support of the World Bank Global Road Safety Facility as part of the Bloomberg Philanthropies’ Initiative for Global Road Safety between 2015 and 2019, and where data for travel by mode and gender was available.
The results show a fascinating story. It shows clearly that our road and street networks are, on the whole, less safe for women than for men.
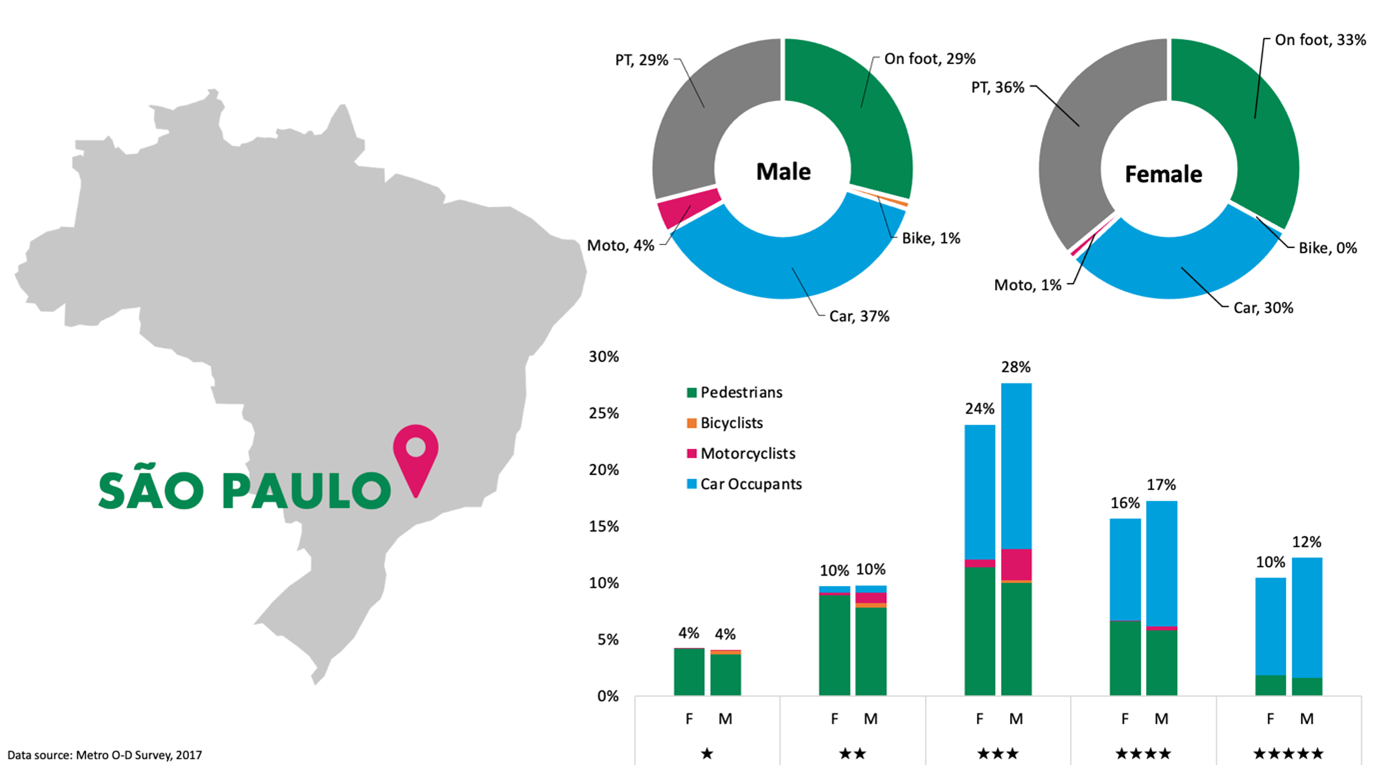
Let’s take a look at São Paulo, Brazil. Men ride bicycles, motorcycles and drive cars more, whereas women take public transit and walk more. However, there is not an enormous difference between men and women in how they travel. Nevertheless the results by Star Rating show that 50% of trips taken by women happen on 3 stars or better roads. For men, this increases to 57%. The São Paulo data highlights the uneven infrastructure quality, where the risks are greater for those walking and cycling.
In Bogota, Colombia, we see are more marked difference between men and women in how they travel, but also that car use is substantially lower overall. Women walk and take public transit more than men, but men are using bicycles and motorcycles in higher numbers. The results show a lower proportion of travel happening on 3 star or better roads for both men and women, which is slightly higher for men at 33% than for women at 30%.
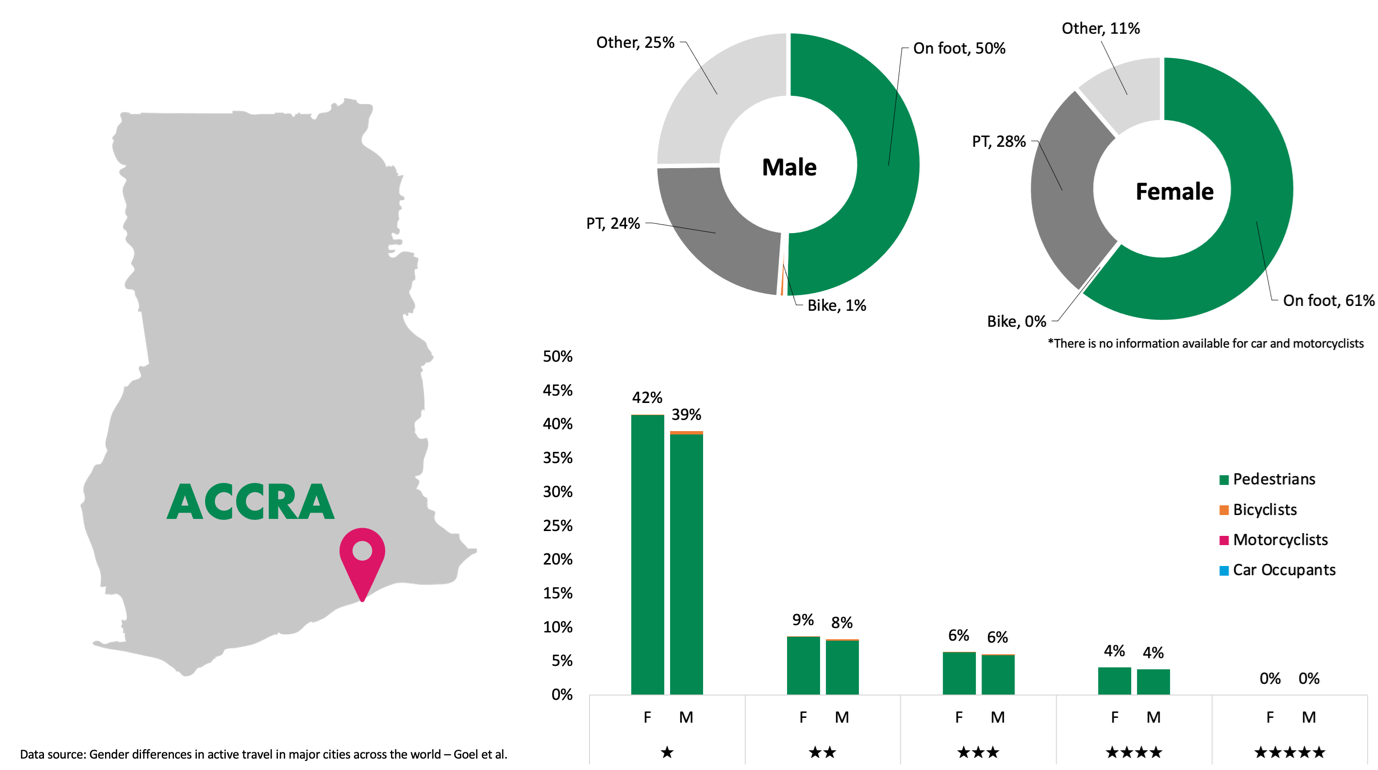
In Accra, Ghana, approximately half of men’s trips and two-thirds of women’s trips are done by walking. Despite this, pedestrian infrastructure is of very poor safety standard. This is even more pronounced for women, for whom more than half of the trips are on 1- or 2-star roads.
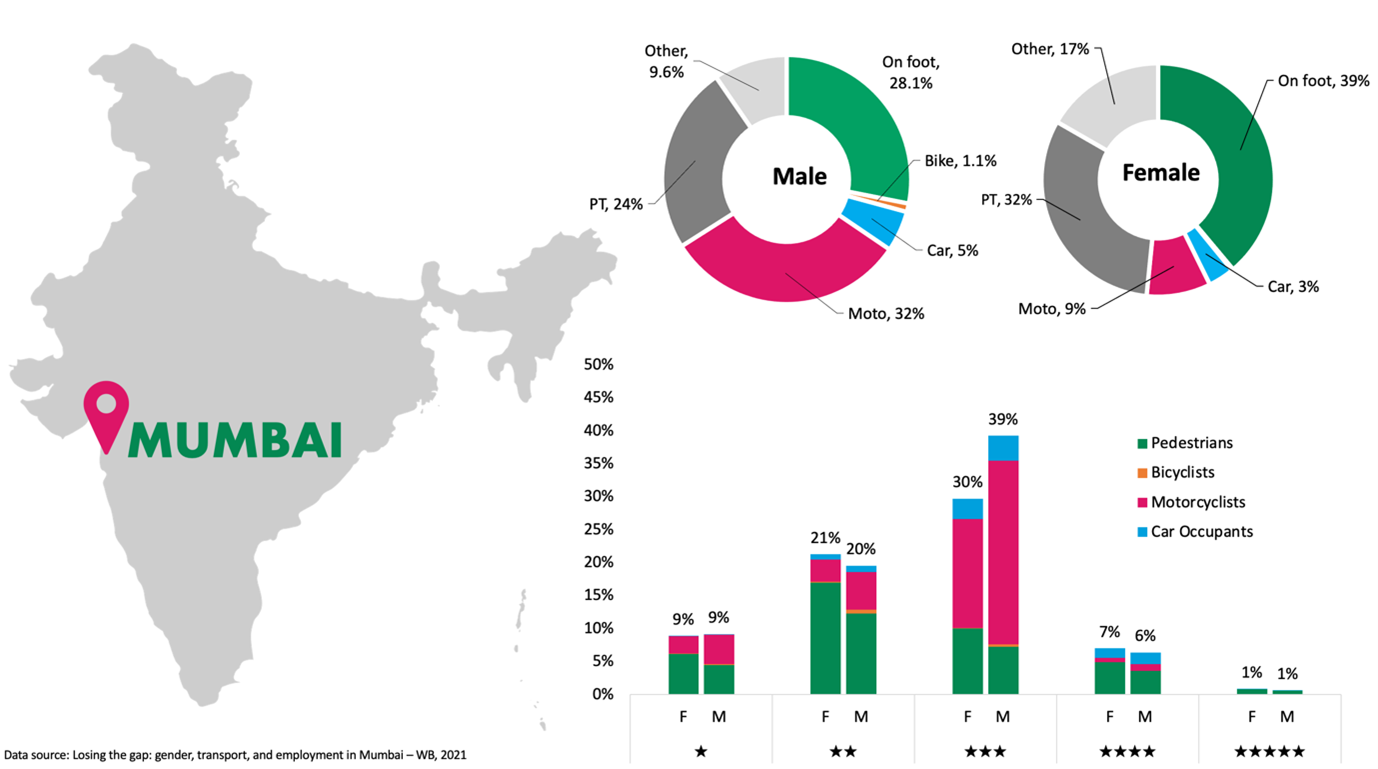
Mumbai, India, has perhaps the biggest gender differences in travel mode. Men use motorcycles in a much higher proportion than women, and women use public transit and walk more. These differences in mode also result in significant differences in relative safety. For men, 46% of trips happen on 3-star or better roads, whereas for women, this decreases to 38% of trips.
Knowing how and where women travel is first step to make changes. We need more data and we need it disaggregated by gender and mode. We need to routinely assess safety across entire road networks. We need more systematic participation of communities in road planning and design.
Understanding the gender differences in mode can help transport authorities better plan and design road networks which reflect the diverse needs of all road users. Join us to speak up for safe infrastructure for women on the International Women’s Day. #Breakthebias #IWD2022
About the author
Monica Olyslagers is iRAP’s Global Innovation Manager and oversees initiatives such as AiRAP for the accelerated and intelligent collection of data for road safety, and CycleRAP, a bicycling and micro-mobility risk assessment model. Monica joined the iRAP team in 2015 as the Programme Coordinator for iRAP’s projects under the Bloomberg Philanthropies Initiative for Global Road Safety.
Monica’s previous roles in the Australian Government’s transport ministry (2007-14) included aviation safety in the PNG and Pacific, the national urban policy and cycling strategy, high speed rail feasibility assessment, and transport policy development.

Monica has a keen interest in improving urban environments for people—all people—for a healthier, safer, and more inclusive, equitable and sustainable future. She holds a Master’s degree in Development Planning and a Bachelor’s degree in Psychology and the Arts. Monica lives in Guangzhou, China.
Special thanks to Shanna Lucchesi for the data analysis and graphics.
Limitations of the analysis presented:
- For the purposes of comparison, public transportation trips are not included in the Star Rating analyses, although they are vital for women and often involve a pedestrian trip. The safety of public transportation in some regions, particularly for cities with a high proportion of informal transit, have different safety outcomes than to standard passenger vehicles, such as private cars or regulated taxis. In other cities with high quality public transport services, safety outcomes for passengers may be the same or safer than travelling in private vehicles or regulated taxis. To include public transport modes in Star Rating analysis, additional data for each type of mode and participation by gender is required at the city level.
- The graphs present the comparison results between the cities modal split with the star rating of networks already assessed using the iRAP methodology. This analysis assumes that the overall city modal split per gender also happens in the network evaluated. We are aware that the networks presented on VIDA do not represent the complete infrastructure of the cities.
- The databases used (model split and star rating results) are not necessarily related in time.

