
Informes interactivos
Informes interactivos
En esta página se muestran ejemplos de informes interactivos elaborados a partir de datos de iRAP. Entre ellos se incluyen informes creados por iRAP y otros elaborados por socios de iRAP. Si te interesa crear un informe interactivo o conoces buenos ejemplos que podrían destacarse en esta página, ponte en contacto con nosotros (por correo electrónico comms@irap.org).
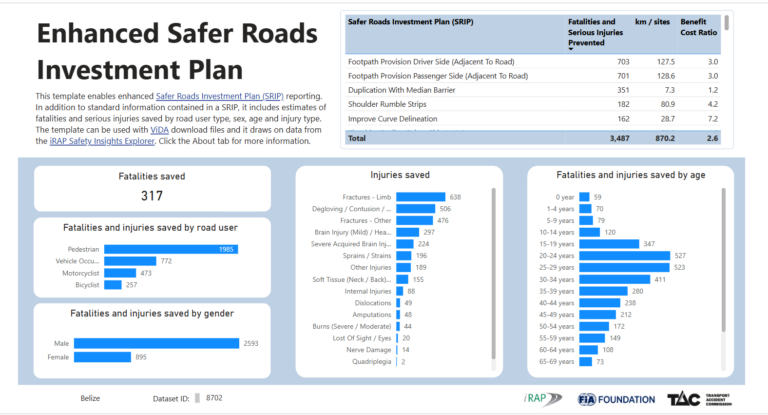
Planes de Inversión Mejorada para Carreteras Más Seguras
Esta plantilla permite mejorar los informes del Programa de Inversión en Carreteras Más Seguras (SRIP). Si está interesado en probar la plantilla con sus propios datos, póngase en contacto con judy.williams@irap.org
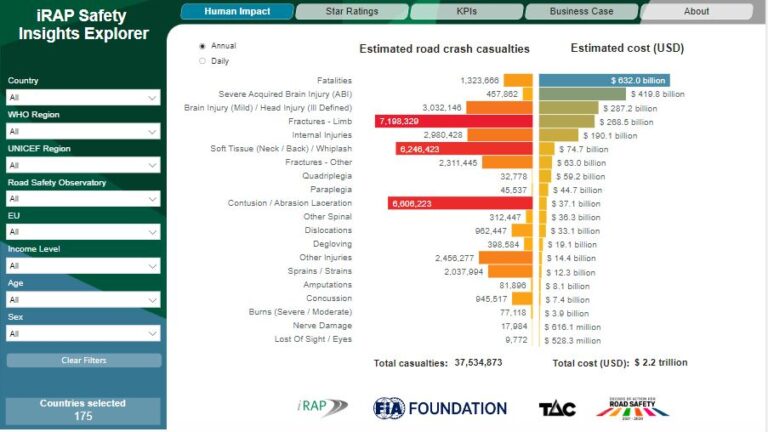
Explorador de Conocimientos de Seguridad de iRAP
El iRAP Safety Insights Explorer arroja luz sobre la verdadera magnitud de los accidentes de tráfico, la seguridad de las carreteras del mundo y el impacto positivo que se puede lograr con la inversión.
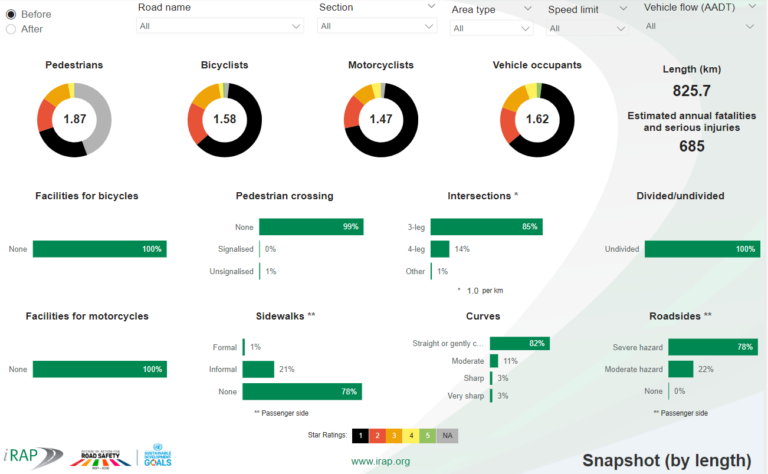
Cuadro de mando del proyecto Power BI de iRAP
Dale vida a tus informes iRAP con esta plantilla gratuita de Power BI. Diseñada para utilizarse con los archivos de descarga estándar de ViDA.
Star Rating for Schools: Herramienta de seguimiento de la seguridad en las escuelas
Informe interactivo de Calificaciones Estrellas para Escuelas (SR4S) que comparte información sobre cómo se está mejorando la seguridad alrededor de las escuelas.
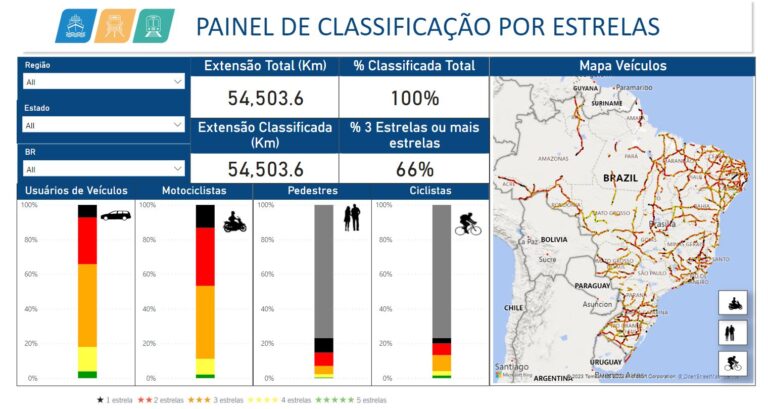
Panel de resultados de Power BI de BrazilRAP
Departamento Nacional de Infraestructura de Transportes de BrasilDNIT) está recopilando y compartiendo datos de evaluación del programa iRAP junto con datos locales sobre accidentes y víctimas mortales en Brasil.
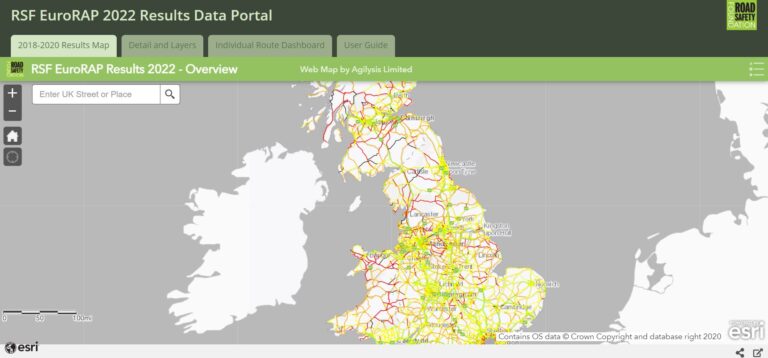
Reino Unido RAP: Informe de la Road Safety Foundation
Estos Fundación para la Seguridad Vial Los mapas web muestran el riesgo estadístico de que se produzca una lesión grave o mortal en la red de autopistas y carreteras ‘A’ de Gran Bretaña.
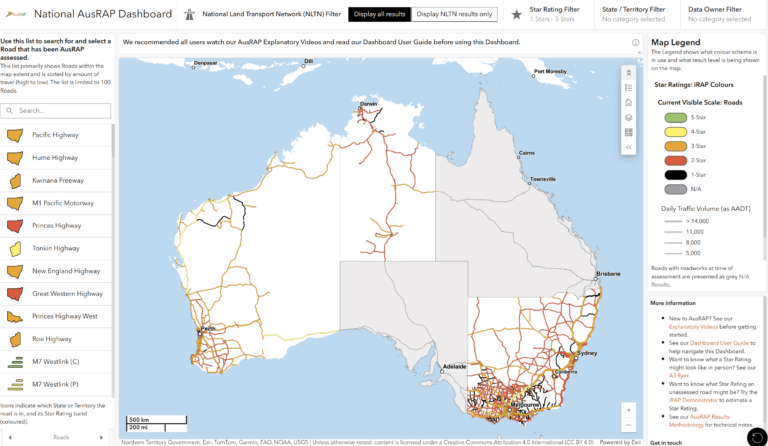
Panel Nacional de AusRAP (Australia)
El panel de control de AusRAP ofrece información sobre la seguridad vial en cinco estados y territorios de Australia – Nueva Gales del Sur (NSW), el Territorio de la Capital Australiana (ACT), Victoria, Australia Occidental y el Territorio del Norte – según la metodología iRAP/AusRAP, que incluye clasificaciones por estrellas, estimaciones de tráfico y registros de víctimas mortales y heridos graves en carretera.
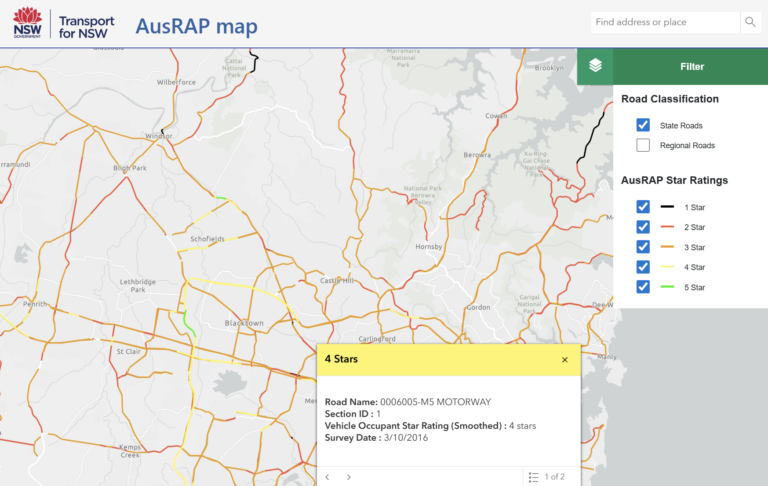
Mapa de Calificación de Estrellas de Nueva Gales del Sur (Australia)
El Gobierno de Nueva Gales del Sur (NSW) de Australia está dando un gran paso adelante en la construcción de una red vial más segura en todo el estado, publicando este mapa digital interactivo en julio de 2025 que muestra las calificaciones de estrellas de seguridad de más de 20.000 km de carreteras estatales y 15.000 km de carreteras regionales.
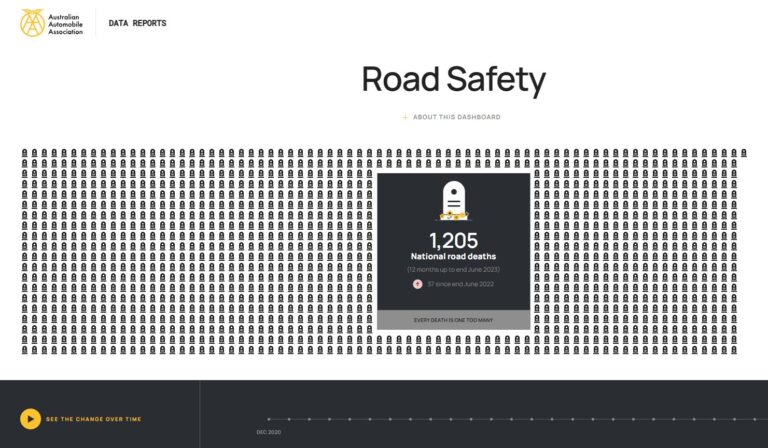
AusRAP: Panel de Datos de Seguridad Vial de la AAA
Del Asociación Automovilística AustralianaEste panel compara el rendimiento de la Estrategia Nacional de Seguridad Vial (NRSS) 2021-2030 del Gobierno de la Commonwealth. Los datos provienen de la Oficina de Economía de Infraestructura y Transporte (BITRE).
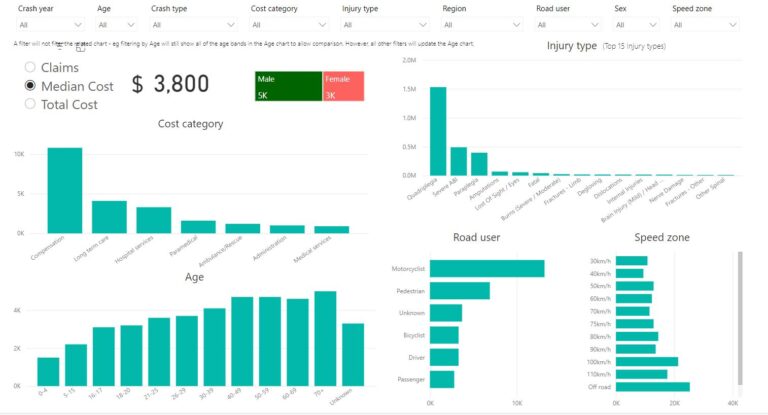
AusRAP: Cuadro de mando de lesiones viales del TAC iRAP
El Comisión de Accidentes de Transporte (TAC) Los datos sobre lesiones de iRAP ofrecen una visión única de los tipos de lesiones, los tipos de accidentes, los tipos de carreteras y los tipos de usuarios de la vía pública implicados, junto con los costes totales de las reclamaciones a lo largo de toda la vida que se derivan de dichas lesiones. El panel de control también destaca en qué áreas del sector sanitario se producen esos costes y cuándo se generan.
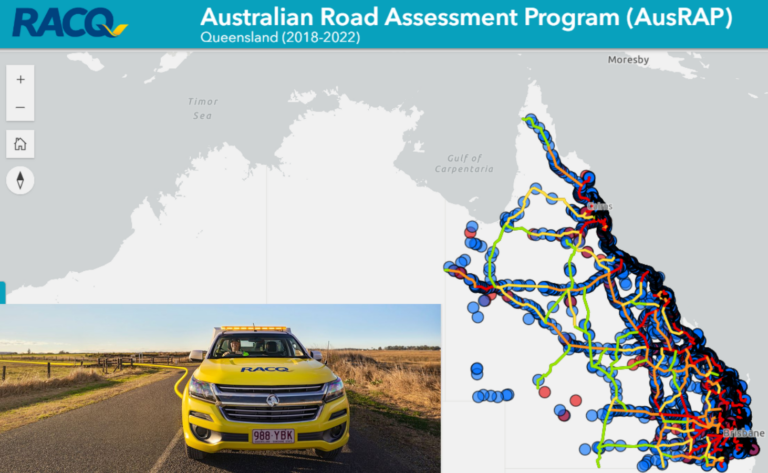
Calificaciones de riesgo AusRAP para carreteras en Queensland
este informe producido por RACQ te permite explorar las calificaciones de riesgo de AusRAP para carreteras en Queensland, Australia
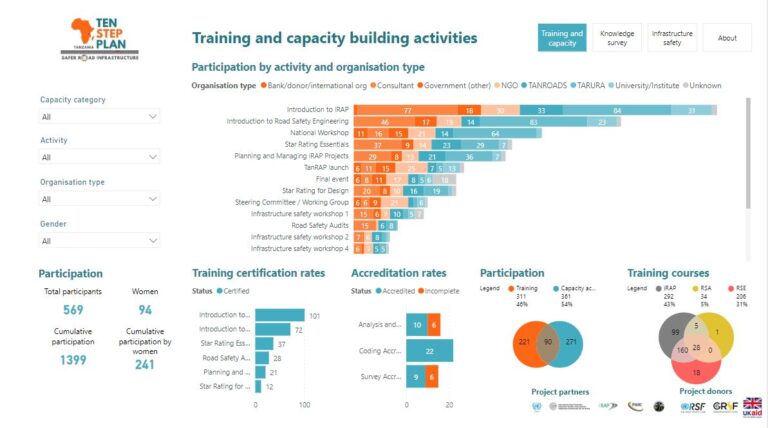
TanRAP: Plan de Diez Pasos de Tanzania
Este panel de control se desarrolló como parte de la Evaluación del Impacto de iRAP, el Plan de Diez Pasos del UNRSF para Infraestructura Vial Más Segura en la Mejora del Desempeño de Seguridad de los BM proyecto, financiado por UK Aid a través de la GRSF.
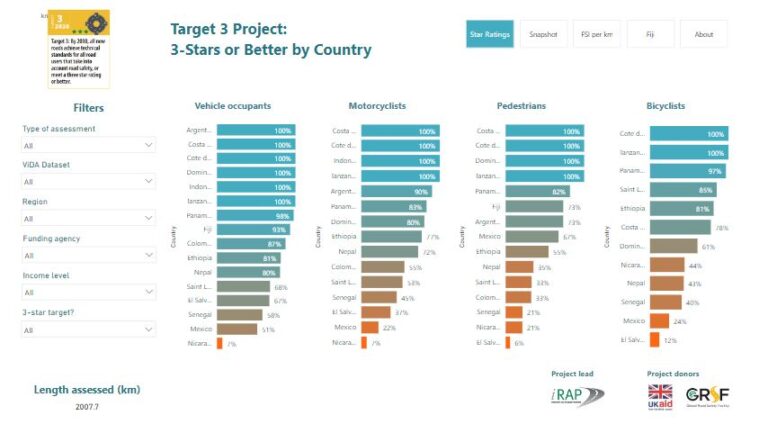
Panel de control del proyecto Objetivo 3
El Proyecto Objetivo 3 analizó más de 30 proyectos de corredores viales en todo el mundo, con un total de más de 2.000 km de carreteras y diseños, para examinar el progreso hacia el objetivo de garantizar que todas las nuevas carreteras sean de 3 estrellas o mejores para todos los usuarios de la vía para 2030. El Panel del Proyecto Objetivo 3 le permite explorar algunos de los datos en detalle.
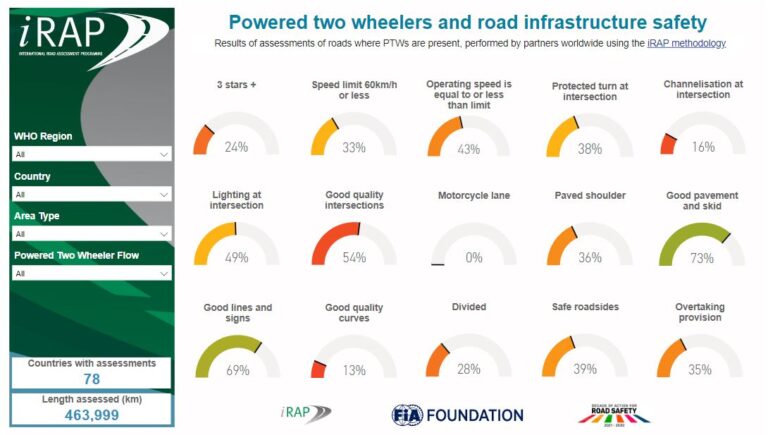
Informe «Powered Two-Wheeler Insights» de iRAP
Para apoyar las discusiones sobre la seguridad de los motociclistas, este informe interactivo de información sobre Motocicletas de Potencia está ahora disponible (originalmente publicado para acompañar el Reunión Anual del Observatorio de Seguridad Vial de Asia y el Pacífico
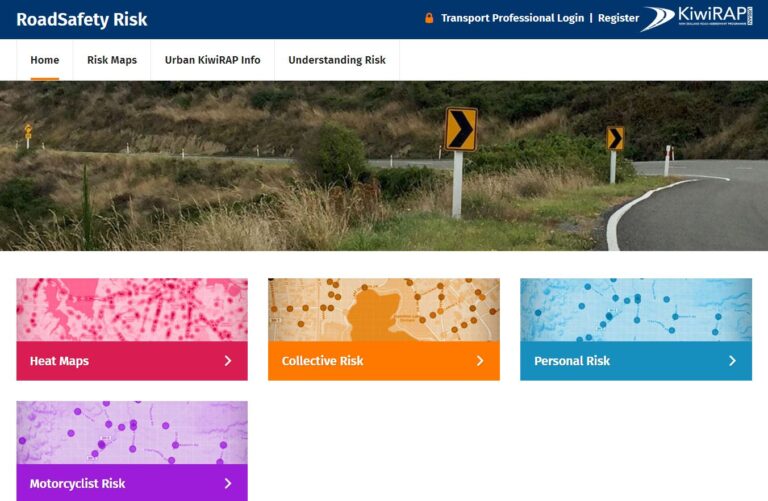
KiwiRAP: Panel de control de RoadSafety Risk NZ
Los datos sobre la red viaria que figuran en este sitio web se han elaborado en el marco de «Safer Journeys», la estrategia de seguridad vial de Nueva Zelanda hasta 2020. Urban KiwiRAP contribuye al objetivo del «Sistema Seguro» de mejorar la seguridad de las carreteras y sus márgenes para reducir la probabilidad de que se produzcan accidentes y minimizar las consecuencias de los mismos en caso de que se produzcan.
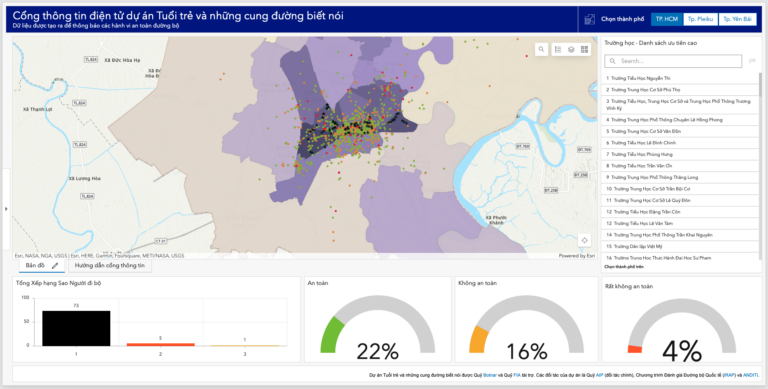
AI&Me – Portal Ciudadano
Este tablero fue desarrollado como parte del proyecto AI&Me: Capacitar a los jóvenes para unas carreteras más seguras, financiado por Fundación Botnar y FIA Foundation.
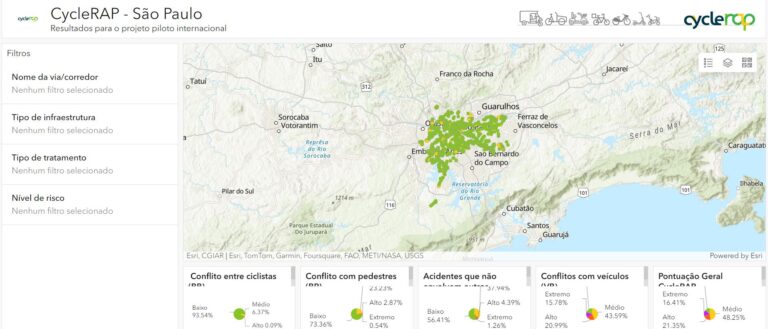
Panel de Resultados CycleRAP – São Paulo, Brasil
Este panel se desarrolló para presentar los resultados de CycleRAP a la ciudad de São Paulo, Brasil. El proyecto fue financiado por Fundación Mapfre, UCI y PTV Group.
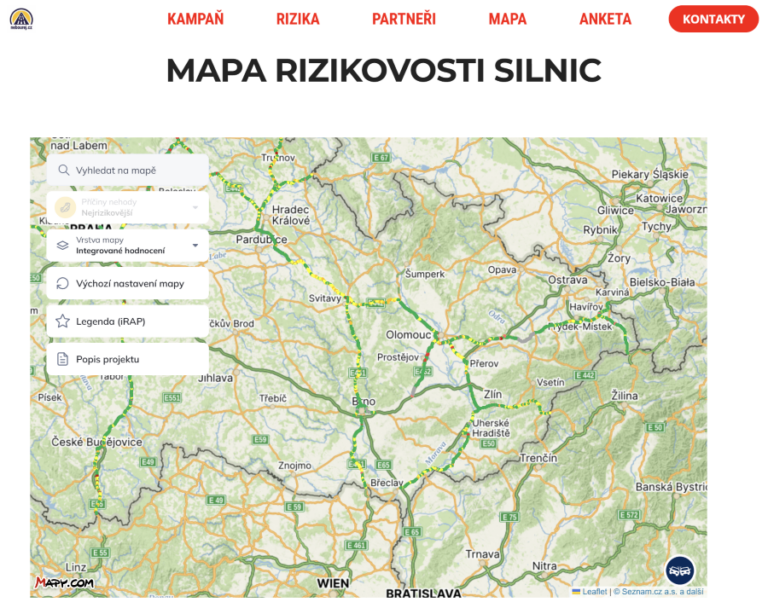
Resultados de calificación de estrellas de Chequia y panel de control de la campaña UAMK para reducir accidentes
Este panel de control presenta los resultados de la clasificación por estrellas iRAP del proyecto y la campaña checos “Reducción de accidentes mediante métodos reconocidos internacionalmente”, llevados a cabo en 2024 en colaboración con la UAMK, iRAP, AFRY y Data Friends, con el apoyo de la Oficina Checa de Aseguradoras (CKP) a través del Fondo de Prevención de Siniestros (FZS).