

Risicokartering van scheuren
Wat is het in kaart brengen van het risico op verkeersongevallen?
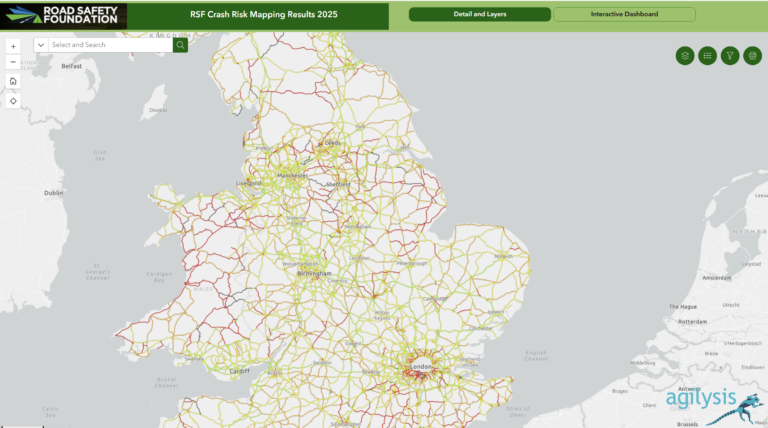
Ongevallenrisicokaarten gebruiken gedetailleerde ongevalsgegevens om het gecombineerde risico vast te leggen dat voortvloeit uit de interactie tussen weggebruikers, voertuigen en de wegomgeving. Risicokaarten geven een indicatie van de algehele prestaties van het wegennet.
De kaarten bieden een objectief en overzichtelijk beeld van waar dodelijke ongevallen en ongevallen met ernstig letsel hebben plaatsgevonden en waar het risico op ernstige ongevallen het grootst is. Door een wereldwijde methodologie te gebruiken, kunnen referentiewaarden worden vastgesteld waar gewenst (bijvoorbeeld ongevalscijfers op snelwegen; ongevalscijfers met voetgangers in steden). De belangrijkste meetwaarden zijn het ongevalsrisico per kilometer/mijl en het ongevalsrisico per afgelegde kilometer.
Risicokaarten voor verkeersongevallen en sterrenclassificaties worden vaak samen gebruikt als onderdeel van een strategische aanpak voor risico- en investeringsbeheer. Ze bieden ook een nuttige basis voor het ijken van FSI-ramingen en investeringsplannen.
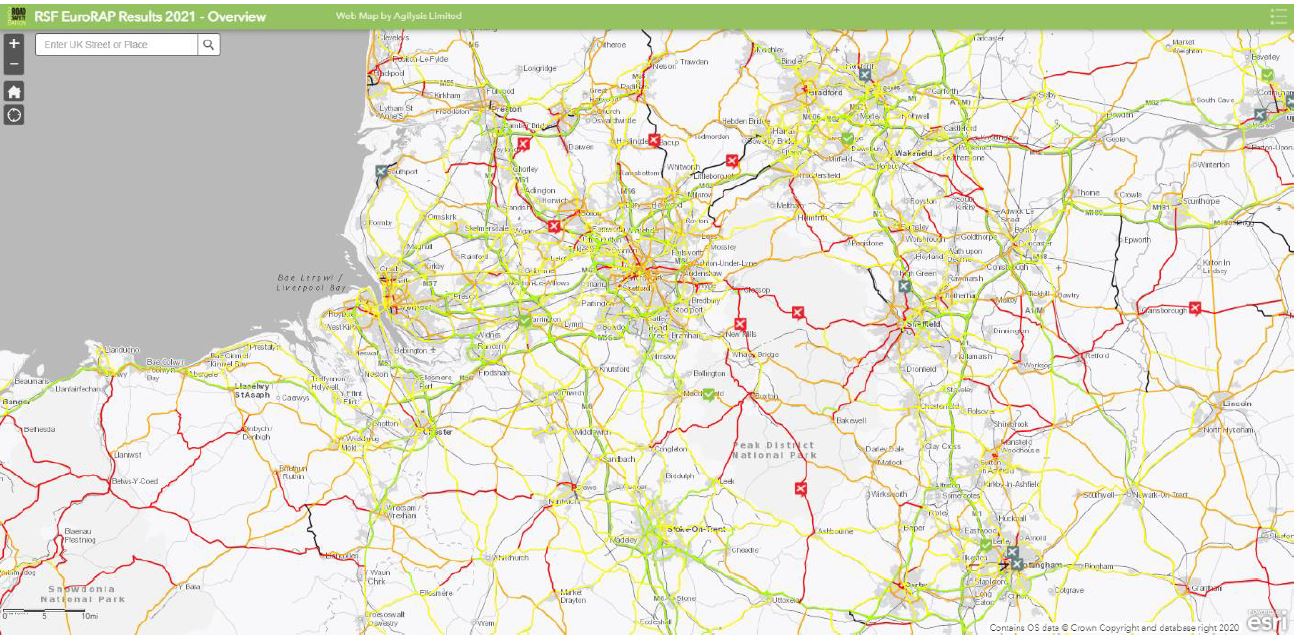
Laatste nieuws over het in kaart brengen van het risico op verkeersongevallen
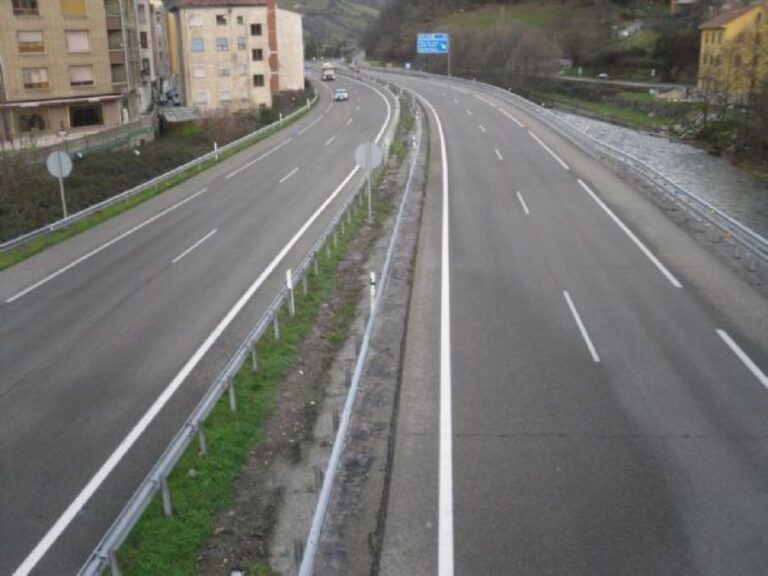
21 maart 2024
25.000 km aan risicokaarten voor verkeersongevallen in Spanje vrijgegeven
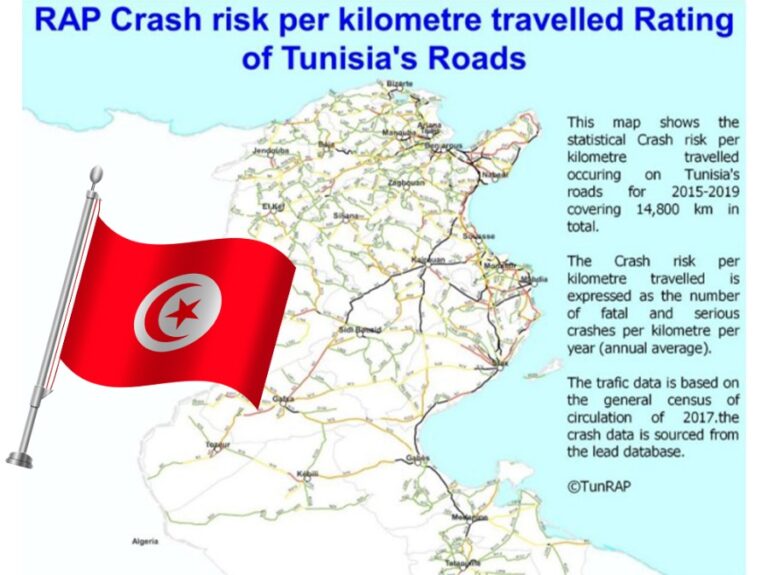
3 februari 2023
14.800 km van Tunesië: risicokartering voltooid
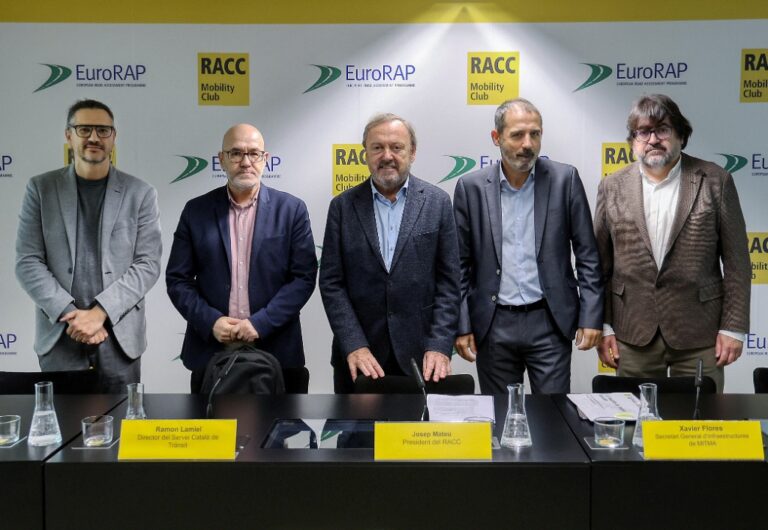
19 januari 2023
21 jaar prestatiemonitoring: de nieuwste resultaten van de risicoanalyse van Catalonië zijn gepubliceerd.
18 december 2025